

Section 10.2: Considerations for Objective Verification
183
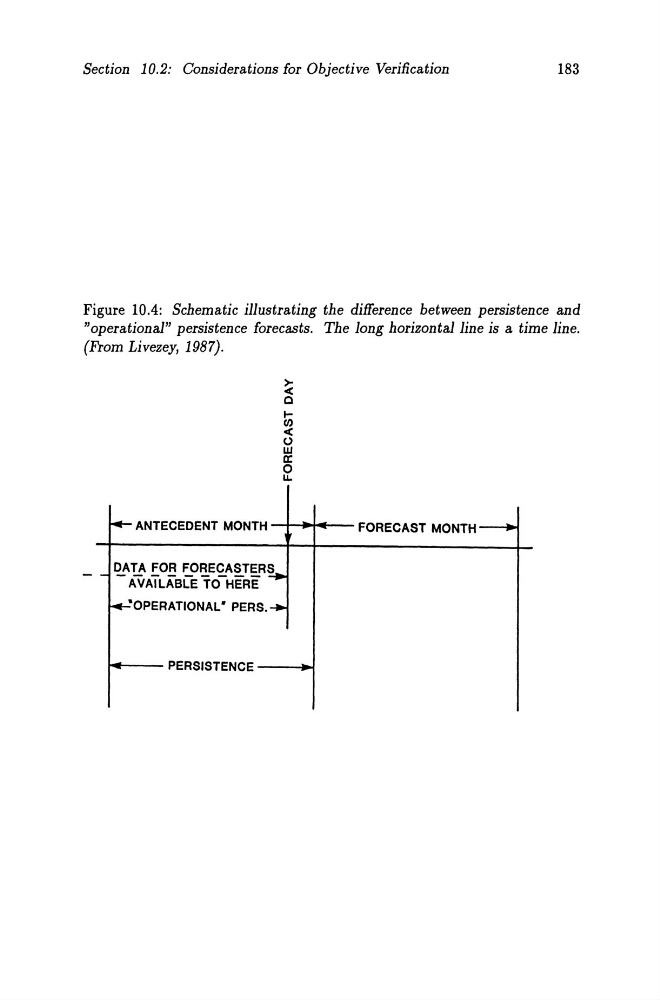
Figure 10.4: Schematic illustrating the difference between persistence and
"operational" persistence forecasts. The long horizontalline is a time line.
(From Livezey, 1987).
-
~ ANTECEDENT MONTH
~
C
ICf)
<
o
W
0::
o u.
~A ~ ~O~ ~0'lE~A§..T§.R~
AVAILABLE TO HERE
~OPERATIONAL· PERS.-+PERSISTENCE
FORECAST MONTH----
183
Figure 10.4: Schematic illustrating the difference between persistence and
"operational" persistence forecasts. The long horizontalline is a time line.
(From Livezey, 1987).
-
~ ANTECEDENT MONTH
~
C
ICf)
<
o
W
0::
o u.
~A ~ ~O~ ~0'lE~A§..T§.R~
AVAILABLE TO HERE
~OPERATIONAL· PERS.-+PERSISTENCE
FORECAST MONTH----