

Section 10.2: Considerations for Objective Verification
181
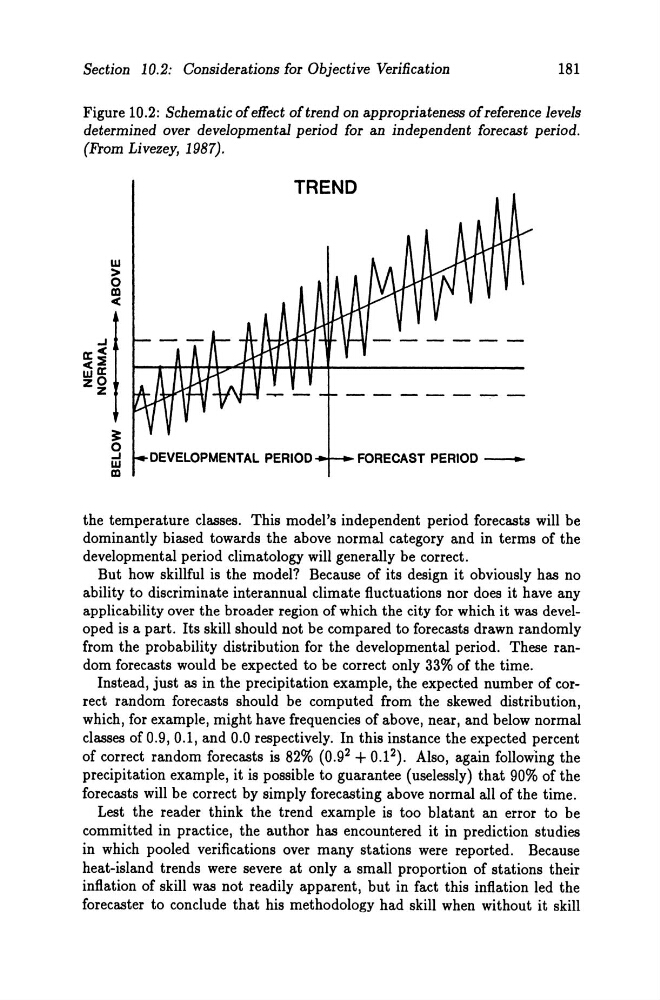
Figure 10.2: Schematic of effect oftrend on appropriateness ofreference levels
determined over developmental period for an independent forecast period.
(From Livezey, 1987).
..J
0::<
<:E
wO::
zO
z
w
>
o m
<
~
o ..J w
m
TREND
DEVELOPMENTAL PERIOD
FORECAST PERIOD -
the temperature classes. This model's independent period forecasts will be
dominantly biased towards the above normal category and in terms of the
developmental period climatology will generally be correct.
But how skillful is the model? Because of its design it obviously has no
ability to discriminate interannual climate fluctuations nor does it have any
applicability over the broader region of which the city for which it was developed is apart. Its skill should not be compared to forecasts drawn randomly
from the prob ability distribution for the developmental period. These random forecasts would be expected to be correct only 33% of the time.
Instead, just as in the precipitation example, the expected number of correet random forecasts should be computed from the skewed distribution,
which, for example, might have frequencies of above, near, and below normal
classes of 0.9,0.1, and 0.0 respectively. In this instance the expected percent
of correct random forecasts is 82% (0.9 2 + 0.1 2 ). Also, again following the
precipitation example, it is possible to guarantee (uselessly) that 90% of the
forecasts will be correct by simply forecasting above normal all of the time.
Lest the reader think the trend example is too blatant an error to be
committed in practice, the author has encountered it in prediction studies
in which pooled verifications over many stations were reported. Because
heat-island trends were severe at only a small proportion of stations their
inflation of skill was not readily apparent, but in fact this inflation led the
fore cast er to conclude that his methodology had skill when without it skill
181
Figure 10.2: Schematic of effect oftrend on appropriateness ofreference levels
determined over developmental period for an independent forecast period.
(From Livezey, 1987).
..J
0::<
<:E
wO::
zO
z
w
>
o m
<
~
o ..J w
m
TREND
DEVELOPMENTAL PERIOD
FORECAST PERIOD -
the temperature classes. This model's independent period forecasts will be
dominantly biased towards the above normal category and in terms of the
developmental period climatology will generally be correct.
But how skillful is the model? Because of its design it obviously has no
ability to discriminate interannual climate fluctuations nor does it have any
applicability over the broader region of which the city for which it was developed is apart. Its skill should not be compared to forecasts drawn randomly
from the prob ability distribution for the developmental period. These random forecasts would be expected to be correct only 33% of the time.
Instead, just as in the precipitation example, the expected number of correet random forecasts should be computed from the skewed distribution,
which, for example, might have frequencies of above, near, and below normal
classes of 0.9,0.1, and 0.0 respectively. In this instance the expected percent
of correct random forecasts is 82% (0.9 2 + 0.1 2 ). Also, again following the
precipitation example, it is possible to guarantee (uselessly) that 90% of the
forecasts will be correct by simply forecasting above normal all of the time.
Lest the reader think the trend example is too blatant an error to be
committed in practice, the author has encountered it in prediction studies
in which pooled verifications over many stations were reported. Because
heat-island trends were severe at only a small proportion of stations their
inflation of skill was not readily apparent, but in fact this inflation led the
fore cast er to conclude that his methodology had skill when without it skill