

180
Chapter 10: The Evaluation of Foreeasts
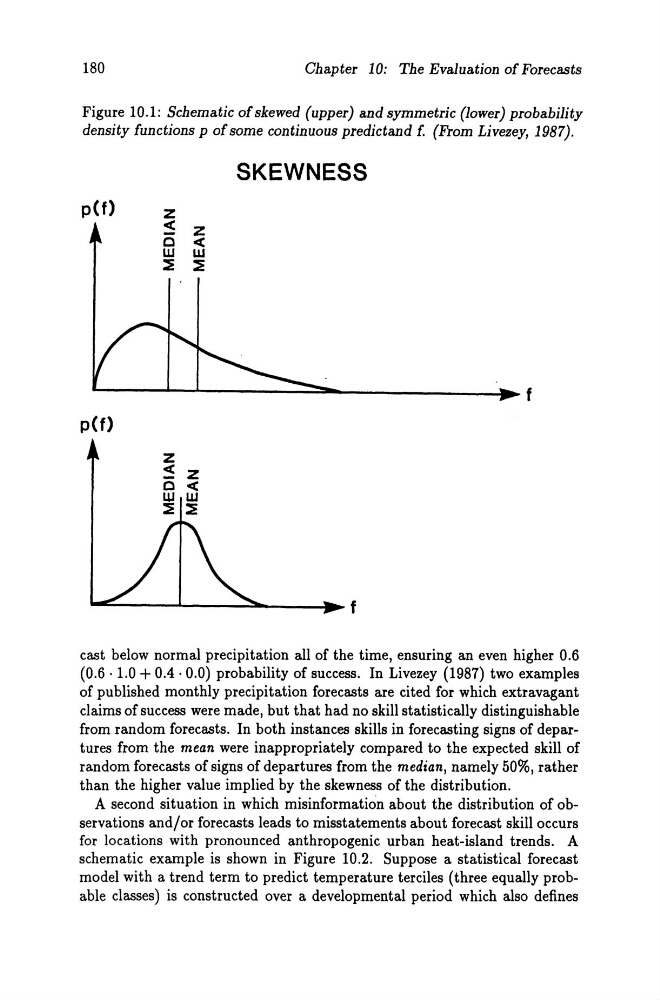
Figure 10.1: Sehematie ofskewed (upper) and symmetrie (lower) probability
density functions p of some eontinuous predietand f. (From Livezey, 1987).
p(t)
z
<
C
w
::E
z
<
w
::E
SKEWNESS
------~--------~~------------~f
p(t)
z
< Z
C <
W w
::E ::E
~----~----~~----~f
east below normal preeipitation all of the time, ensuring an even higher 0.6
(0.6· 1.0 + 0.4 . 0.0) probability of sueeess. In Livezey (1987) two examples
of published monthly preeipitation foreeasts are cited for whieh extravagant
claims of sueeess were made, but that had no skill statistieally distinguishable
from random foreeasts. In both instanees skills in foreeasting signs of departures from the mean were inappropriately eompared to the expected skill of
random foreeasts of signs of departures from the median, namely 50%, rather
than the higher value implied by the skewness of the distribution.
A seeond situation in whieh misinformation ab out the distribution of observations and/or foreeasts leads to misstatements about foreeast skill oeeurs
for loeations with pronouneed anthropogenie urban heat-island trends. A
sehematie example is shown in Figure 10.2. Suppose a statistieal foreeast
model with a trend term to predict temperature terciles (three equally probable classes) is eonstructed over a developmental period whieh also defines
Chapter 10: The Evaluation of Foreeasts
Figure 10.1: Sehematie ofskewed (upper) and symmetrie (lower) probability
density functions p of some eontinuous predietand f. (From Livezey, 1987).
p(t)
z
<
C
w
::E
z
<
w
::E
SKEWNESS
------~--------~~------------~f
p(t)
z
< Z
C <
W w
::E ::E
~----~----~~----~f
east below normal preeipitation all of the time, ensuring an even higher 0.6
(0.6· 1.0 + 0.4 . 0.0) probability of sueeess. In Livezey (1987) two examples
of published monthly preeipitation foreeasts are cited for whieh extravagant
claims of sueeess were made, but that had no skill statistieally distinguishable
from random foreeasts. In both instanees skills in foreeasting signs of departures from the mean were inappropriately eompared to the expected skill of
random foreeasts of signs of departures from the median, namely 50%, rather
than the higher value implied by the skewness of the distribution.
A seeond situation in whieh misinformation ab out the distribution of observations and/or foreeasts leads to misstatements about foreeast skill oeeurs
for loeations with pronouneed anthropogenie urban heat-island trends. A
sehematie example is shown in Figure 10.2. Suppose a statistieal foreeast
model with a trend term to predict temperature terciles (three equally probable classes) is eonstructed over a developmental period whieh also defines