

Surface Fluxes of Momentum, Heat, and Water Vapor
77
first estimating c from u and then cO from c and inertial subrange scaling of B; possible errors
due to the jumpiness of the spectra when examined over a narrow range of wavenumbers; and,
the need for an iterative solution of heat fluxes. We avoid all of these problems with the present
approach.
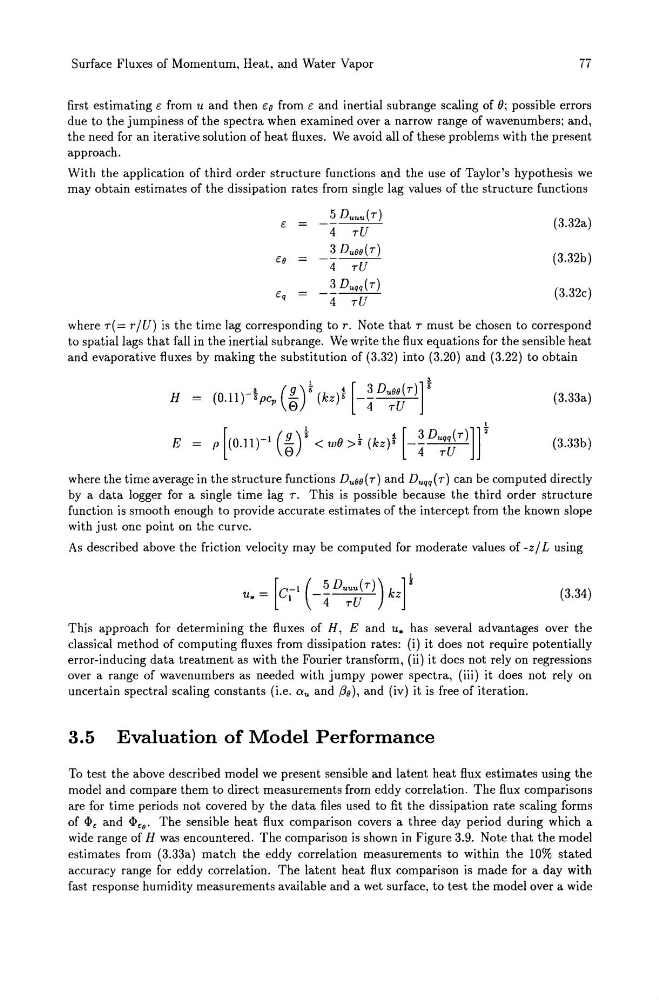
With the application of third order structure functions and the use of Taylor's hypothesis we
may obtain estimates of the dissipation rates from single lag values of the structure functions
5 Duuu(T)
(3.32a)
c
- - - - -
4 TU
3 DuOO(T)
(3.32b)
cO
- - - - -
4 TU
Cq =
_~ Duqq(T)
(3.32c)
4 TU
where T(= r/U) is the time lag corresponding to r. Note that T must be chosen to correspond
to spatial lags that fall in the inertial subrange. We write the flux equations for the sensible heat
and evaporative fluxes by making the substitution of (3.32) into (3.20) and (3.22) to obtain
H =
(3.33a)
E =
(3.33b)
where the time average in the structure functions Duoo( T) and Duqq( T) can be computed directly
by a data logger for a single time lag T. This is possible because the third order structure
function is smooth enough to provide accurate estimates of the intercept from the known slope
with just one point on the curve.
As described above the friction velocity may be computed for moderate values of -z/ L using
(3.34)
This approach for determining the fluxes of H, E and u. has several advantages over the
classical method of computing fluxes from dissipation rates: (i) it does not require potentially
error-inducing data treatment as with the Fourier transform, (ii) it does not rely on regressions
over a range of wavenumbers as needed with jumpy power spectra, (iii) it does not rely on
uncertain spectral scaling constants (i.e. au and 130), and (iv) it is free of iteration.
3.5 Evaluation of Model Performance
To test the above described model we present sensible and latent heat flux estimates using the
model and compare them to direct measurements from eddy correlation. The flux comparisons
are for time periods not covered by the data files used to fit the dissipation rate scaling forms
of
estimates from (3.33a) match the eddy correlation measurements to within the 10% stated
accuracy range for eddy correlation. The latent heat flux comparison is made for a day with
fast response humidity measurements available and a wet surface, to test the model over a wide
77
first estimating c from u and then cO from c and inertial subrange scaling of B; possible errors
due to the jumpiness of the spectra when examined over a narrow range of wavenumbers; and,
the need for an iterative solution of heat fluxes. We avoid all of these problems with the present
approach.
With the application of third order structure functions and the use of Taylor's hypothesis we
may obtain estimates of the dissipation rates from single lag values of the structure functions
5 Duuu(T)
(3.32a)
c
- - - - -
4 TU
3 DuOO(T)
(3.32b)
cO
- - - - -
4 TU
Cq =
_~ Duqq(T)
(3.32c)
4 TU
where T(= r/U) is the time lag corresponding to r. Note that T must be chosen to correspond
to spatial lags that fall in the inertial subrange. We write the flux equations for the sensible heat
and evaporative fluxes by making the substitution of (3.32) into (3.20) and (3.22) to obtain
H =
(3.33a)
E =
(3.33b)
where the time average in the structure functions Duoo( T) and Duqq( T) can be computed directly
by a data logger for a single time lag T. This is possible because the third order structure
function is smooth enough to provide accurate estimates of the intercept from the known slope
with just one point on the curve.
As described above the friction velocity may be computed for moderate values of -z/ L using
(3.34)
This approach for determining the fluxes of H, E and u. has several advantages over the
classical method of computing fluxes from dissipation rates: (i) it does not require potentially
error-inducing data treatment as with the Fourier transform, (ii) it does not rely on regressions
over a range of wavenumbers as needed with jumpy power spectra, (iii) it does not rely on
uncertain spectral scaling constants (i.e. au and 130), and (iv) it is free of iteration.
3.5 Evaluation of Model Performance
To test the above described model we present sensible and latent heat flux estimates using the
model and compare them to direct measurements from eddy correlation. The flux comparisons
are for time periods not covered by the data files used to fit the dissipation rate scaling forms
of
estimates from (3.33a) match the eddy correlation measurements to within the 10% stated
accuracy range for eddy correlation. The latent heat flux comparison is made for a day with
fast response humidity measurements available and a wet surface, to test the model over a wide