

78
J.D. Albertson, G. Kiely and M.B. Parlange
range of LE. Only one day of data is available for this comparison. The comparison of model
estimates of LE using (3.33b) to eddy correlation measurements of LE is shown in Figure 3.10.
This agreement is also considered excellent.
DSL
DCSL
FCSL
101 -
3 Subl.yer Model
Production (Bus Inger-Dyer)
~
100
--_t
w
e
T
t
10-1
10-3
10-2
10-1
100
101
-z/L
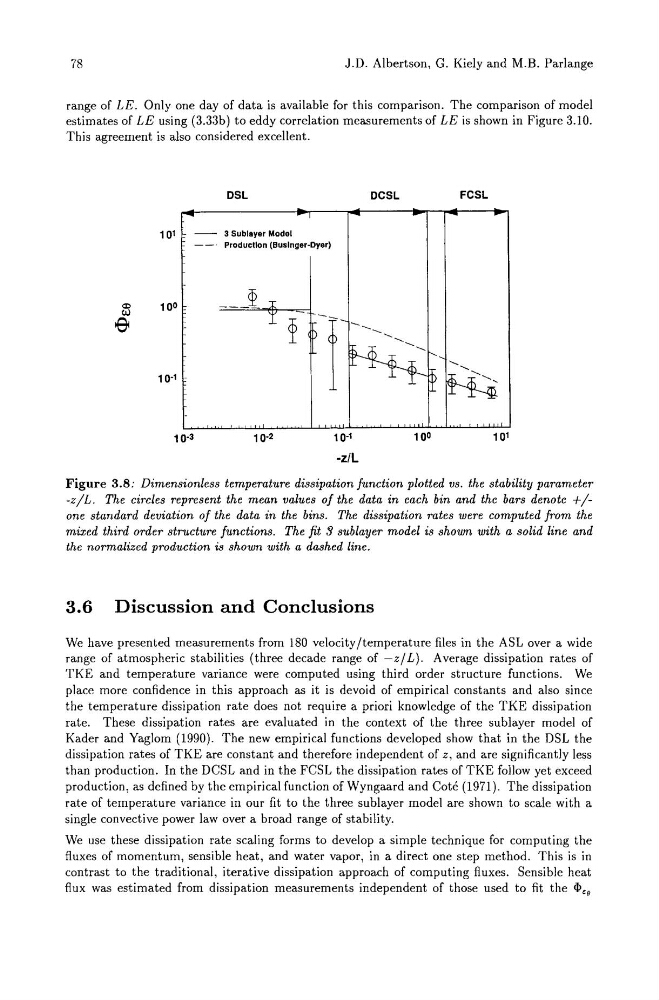
Figure 3.8: Dimensionless temperature dissipation function plotted vs. the stability parameter
-zIL. The circles represent the mean values of the data in each bin and the bars denote +1one standard deviation of the data in the bins. The dissipation rates were computed from the
mixed third order structure functions. The fit 3 sublayer model is shown with a solid line and
the normalized production is shown with a dashed line.
3.6 Discussion and Conclusions
We have presented measurements from 180 velocity/temperature files in the ASL over a wide
range of atmospheric stabilities (three decade range of -z/ L). Average dissipation rates of
TKE and temperature variance were computed using third order structure functions. We
place more confidence in this approach as it is devoid of empirical constants and also since
the temperature dissipation rate does not require a priori knowledge of the TKE dissipation
rate. These dissipation rates are evaluated in the context of the three sublayer model of
Kader and Yaglom (1990). The new empirical functions developed show that in the DSL the
dissipation rates of TKE are constant and therefore independent of z, and are significantly less
than production. In the DCSL and in the FCSL the dissipation rates of TKE follow yet exceed
production, as defined by the empirical function of Wyngaard and Cote (1971). The dissipation
rate of temperature variance in our fit to the three sublayer model are shown to scale with a
single convective power law over a broad range of stability.
We use these dissipation rate scaling forms to develop a simple technique for computing the
fluxes of momentum, sensible heat, and water vapor, in a direct one step method. This is in
contrast to the traditional, iterative dissipation approach of computing fluxes. Sensible heat
flux was estimated from dissipation measurements independent of those used to fit the
J.D. Albertson, G. Kiely and M.B. Parlange
range of LE. Only one day of data is available for this comparison. The comparison of model
estimates of LE using (3.33b) to eddy correlation measurements of LE is shown in Figure 3.10.
This agreement is also considered excellent.
DSL
DCSL
FCSL
101 -
3 Subl.yer Model
Production (Bus Inger-Dyer)
~
100
--_t
w
e
T
t
10-1
10-3
10-2
10-1
100
101
-z/L
Figure 3.8: Dimensionless temperature dissipation function plotted vs. the stability parameter
-zIL. The circles represent the mean values of the data in each bin and the bars denote +1one standard deviation of the data in the bins. The dissipation rates were computed from the
mixed third order structure functions. The fit 3 sublayer model is shown with a solid line and
the normalized production is shown with a dashed line.
3.6 Discussion and Conclusions
We have presented measurements from 180 velocity/temperature files in the ASL over a wide
range of atmospheric stabilities (three decade range of -z/ L). Average dissipation rates of
TKE and temperature variance were computed using third order structure functions. We
place more confidence in this approach as it is devoid of empirical constants and also since
the temperature dissipation rate does not require a priori knowledge of the TKE dissipation
rate. These dissipation rates are evaluated in the context of the three sublayer model of
Kader and Yaglom (1990). The new empirical functions developed show that in the DSL the
dissipation rates of TKE are constant and therefore independent of z, and are significantly less
than production. In the DCSL and in the FCSL the dissipation rates of TKE follow yet exceed
production, as defined by the empirical function of Wyngaard and Cote (1971). The dissipation
rate of temperature variance in our fit to the three sublayer model are shown to scale with a
single convective power law over a broad range of stability.
We use these dissipation rate scaling forms to develop a simple technique for computing the
fluxes of momentum, sensible heat, and water vapor, in a direct one step method. This is in
contrast to the traditional, iterative dissipation approach of computing fluxes. Sensible heat
flux was estimated from dissipation measurements independent of those used to fit the