

542
3.0 r--::IIa-t""Te-:-:3~/:-3_'=3-::/q-/=77"'----'----'----'
PolarIzation: HH
~
l2.0
. .
'" '" c:
~ 1.0
=~
~ 0.0
5
iii
0
~
Angle of IncIdence e: SO·
Snow Depth: 48 an
lIoter EquIvalent: 10.500
, •• ,0 ••••
p.... . . . . . .
./.
.. ...
0············-·····-··
0:1 -5
t>
~
~~ f
~ -10
\ I
~
.~ ~ .. __ -.. ---.a..:.. .. -_.
u -15
'l....,' 8.66Hz
g'
....
tJ. tJ.
-.:
-n~o6ft-J.>.
AJ----tl -20
tJ. ""'2r~~q.6 6Hz
5
'" -25
TIlle of Day
M. Hallikainen
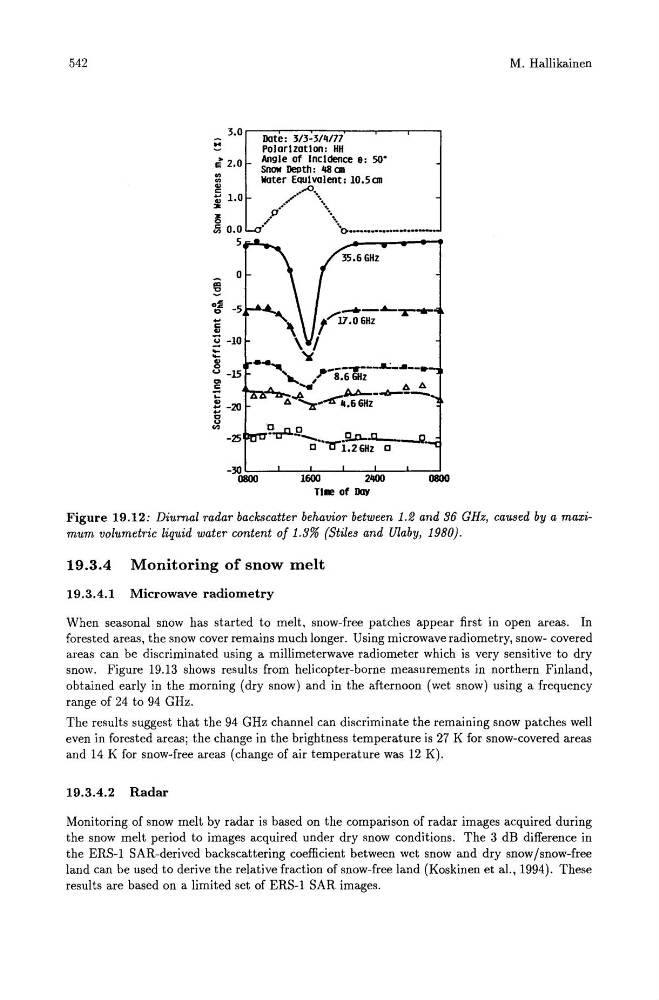
Figure 19.12: Diurnal radar backscatter behavior between 1.2 and 36 GHz, caused by a maximum volumetric liquid water content of 1.3% (Stiles and Ulaby, 1980).
19.3.4 Monitoring of snow melt
19.3.4.1 Microwave radiometry
When seasonal snow has started to melt, snow-free patches appear first in open areas. In
forested areas, the snow cover remains much longer. Using microwave radiometry, snow- covered
areas can be discriminated using a millimeterwave radiometer which is very sensitive to dry
snow. Figure 19.13 shows results from helicopter-borne measurements in northern Finland,
obtained early in the morning (dry snow) and in the afternoon (wet snow) using a frequency
range of 24 to 94 GHz.
The results suggest that the 94 GHz channel can discriminate the remaining snow patches well
even in forested areas; the change in the brightness temperature is 27 K for snow-covered areas
and 14 K for snow-free areas (change of air temperature was 12 K).
19.3.4.2 Radar
Monitoring of snow melt by radar is based on the comparison of radar images acquired during
the snow melt period to images acquired under dry snow conditions. The 3 dB difference in
the ERS-1 SAR-derived backscattering coefficient between wet snow and dry snow/snow-free
land can be used to derive the relative fraction of snow-free land (Koskinen et al., 1994). These
results are based on a limited set of ERS-1 SAR images.