

534
M. Hallikainen
Ice Type ITAh
ITho
IT ..
cr"""". 4>M .. - I Phh",,- I E vv/hh hv/hh
p- ThI
-38.7 -47.6 -34.7 -39.8
0.0
0.49
0.57 4.0
-8.9
FYS
-30.4 -42.4 -26.5 -29.8
0.1
0.73
0.39 3.9
-12.0
FYR
-24.8 -36.5 -21.7 -24.6
0.1
0.74
0.41 3.0
-11.7
MY
-28.0 -42.0 -24.9 -27.2
-0.1
0.85
0.28 3.1
-14.0
FYRR
-20.5 -31.6 -18.1 -20.6
0.0
0.74
0.44 2.4
-11.1
CFY
-19.2 -29.4 -16.9 -19.3
-0.0
0.75
0.45 2.2
-10.2
L- ThI
-35.9 -44.7 -30.6 -35.9
0.0
0.55
0.48 5.4
-8.8
FYS
-26.2 -37.8 -22.5 -25.6
0.1
0.74
0.39 3.6
-11.6
FYR
-23.2 -33.9 -19.6 -22.7
0.1
0.74
0.41 3.6
-10.7
MY
-23.0 -34.6 -18.8 -21.6
-0.0
0.85
0.28 4.2
-11.5
FYRR
-20.1 -30.0 -16.7 -19.7
0.0
0.74
0.43 3.4
-9.8
CFY
-17.7 -25.4 -14.2 -17.5
-0.0
0.71
0.50 3.5
-7.8
C- ThI
-27.9 -35.8 -26.0 -30.8
-0.2
0.41
0.71 1.9
-7.9
FYS
-20.8 -33.5 -20.6 -22.4
-0.2
0.68
0.50 0.2
-12.6
FYR
-19.5 -31.7 -19.1 -20.8
·0.2
0.71
0.49 0.4
-12.1
MY
·12.8 ·22.2 -lI.8 -14.1
-0.0
0.67
0.56 1.0
-9.3
FYRR
-17.6 ·28.9 -17.2 -19.0
-0.2
0.70
0.51 0.5
-11.2
CFY
-12.9 ·21.2 -12.1 ·14.9
-0.1
0.58
0.65 0.8
-8.3
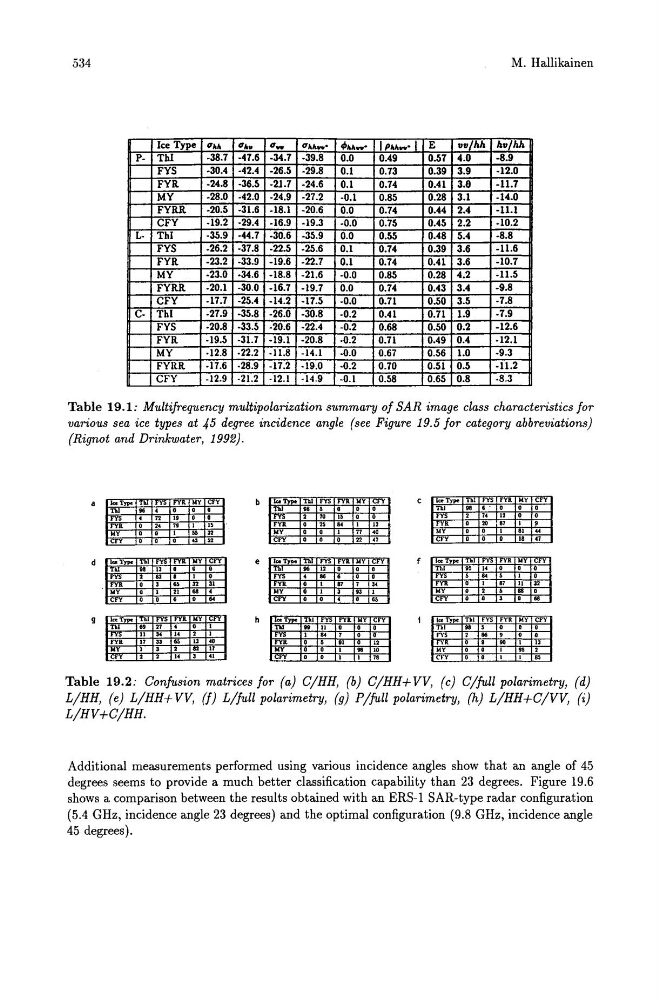
Table 19.1: Multifrequency multipolarization summary of SAR image class characteristics for
various sea ice types at 45 degree incidence angle (see Figure 19.5 for category abbreviations)
(Rignot and Drinkwater, 1992).
"'Ty .. Thl FY' FYA NY cry
Thl
. . , 0 0 0
FY'
, 72 "
0
0
FYA
0
"
1lI
1
"
NY
0
0
1
. . 32
"'Typo T .. FYS FYR NY CFY
Thl
.. , 0 0 0
2
10
"
0
0
FY.
0
" .. 1 12
NY
0
0
1
77
. .
Ice Type Tbl FY' fY. NY CFY
Thl
.. · .
0
• •
FY
2
"
I' 0 0
FY.
0
20
87
1
~
NY
• •
1
81
..
fY
0
0
0
" "
FY
0
0
0
22
"
CFY
0
0
0
1.
"
Tbl fY
FYA
Y
FY
e ... M IT fn NY CfY
Ice Type TbI
•
IfY
fY
hl
. . 13 0 0 0
Thl
.. 12 0 0 0
ThI
" "
0
0
0
2
83
•
1
0
FY'
, . . •
0
0
fY'
, . . , I 0
FYR
0
, . . 32 31
FYR
0
1
87
7
,.
fn
0
I
87
II
32
NY
0
1
21
. . ,
MY
0
1
, "
1
MY
0
2
, . . 0
CfY
0
0
•
0
. .
CFY
0
0
·
0
os
CFY
0
0
, • . .
IaiType Thl FYS fY' NY
hi FV' FYO
V CFY
1« Type TbI FY' Fya MY CfV
Tbl
. . 27 , 0 1
Thl
. . 11 •
0
0
Thl
.. , 0 0 •
11
"
1<
2
1
FYS
1
. . 7 0 0
rvs
, . . 9 0 •
FYA
17
"
. . 13 . .
A
0
, . . 0 12
fYR
0
•
90
I
13
NY
1
3
2
., 17
NY
0
0
1
. . 10
MV
0
0
I
.. ,
FY
2
2
1<
, <1
FY
0
0
1
I
78
cry
0
0
I
I
"
Table 19.2: Confusion matrices for (a) C/HH, (b) C/HH+ VV, (c) C/full polarimetry, (d)
L/HH, (e) L/HH+VV, (f) L/full polarimetry, (g) P/jull polarimetry, (h) L/HH+C/VV, (i)
L/HV+C/HH.
Additional measurements performed using various incidence angles show that an angle of 45
degrees seems to provide a much better classification capability than 23 degrees. Figure 19.6
shows a comparison between the results obtained with an ERS-1 SAR-type radar configuration
(5.4 GHz, incidence angle 23 degrees) and the optimal configuration (9.8 GHz, incidence angle
45 degrees).