

Physical Basis for Microwave Remote Sensing ...
300
look Angle' sr1'
Density of Snow, 03 g/cm'
Diameter of Snow Particle: 1.0 mm
Bottom Rough. RMS = 0.3
~ 250 - - - - - - - - - - - - - - 1 8 V
1 ~-------------18H
:: 200
.. C
DV
:E
~
37H
cD
150 0 ~ ----:100::------'200'-:----=-'300
Woter Equivalent (mm I
519
120
LookAngl", SO"
Horizontal Polarization
100
Density 01 SIlO'" 0. 3 glen·
- - Plane Boundary
- - Bottom Rough. RMS -0.3
80
Q
~60
1.0mm
... "
o.1Smm
o.Smm
-20 0
100
200
300
Water Equivalent (mm)
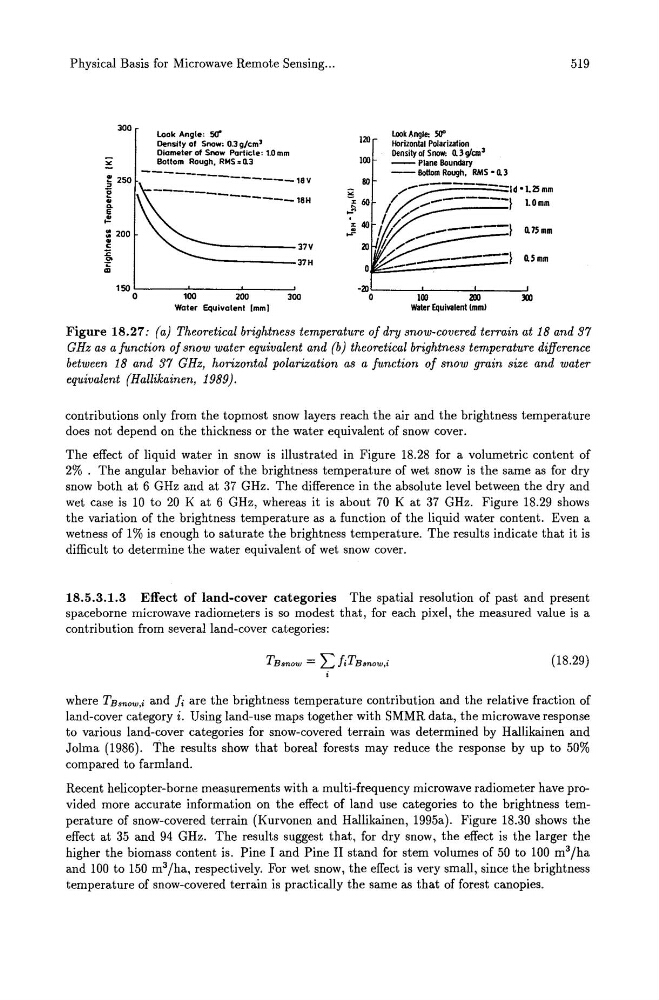
Figure 18.27: (a) Theoretical brightness temperature 0/ dry snow-covered terrain at 18 and 37
GHz as a function 0/ snow water equivalent and (b) theoretical brightness temperature difference
between 18 and 37 GHz, horizontal polarization as a function 0/ snow grain size and water
equivalent (Hallikainen, 1989).
contributions only from the topmost snow layers reach the air and the brightness temperature
does not depend on the thickness or the water equivalent of snow cover.
The effect of liquid water in snow is illustrated in Figure 18.28 for a volumetric content of
2% . The angular behavior of the brightness temperature of wet snow is the same as for dry
snow both at 6 GHz and at 37 GHz. The difference in the absolute level between the dry and
wet case is 10 to 20 K at 6 GHz, whereas it is about 70 K at 37 GHz. Figure 18.29 shows
the variation of the brightness temperature as a function of the liquid water content. Even a
wetness of 1 % is enough to saturate the brightness temperature. The results indicate that it is
difficult to determine the water equivalent of wet snow cover.
18.5.3.1.3 Effect of land-cover categories The spatial resolution of past and present
spaceborne microwave radiometers is so modest that, for each pixel, the measured value is a
contribution from several land-cover categories:
(18.29)
where TBsnow,i and /i are the brightness temperature contribution and the relative fraction of
land-cover category i. Using land-use maps together with SMMR data, the microwave response
to various land-cover categories for snow-covered terrain was determined by Hallikainen and
Jolma (1986). The results show that boreal forests may reduce the response by up to 50%
compared to farmland.
Recent helicopter-borne measurements with a multi-frequency microwave radiometer have provided more accurate information on the effect of land use categories to the brightness temperature of snow-covered terrain (Kurvonen and Hallikainen, 1995a). Figure 18.30 shows the
effect at 35 and 94 GHz. The results suggest that, for dry snow, the effect is the larger the
higher the biomass content is. Pine I and Pine II stand for stem volumes of 50 to 100 m 3 /ha
and 100 to 150 m 3 /ha, respectively. For wet snow, the effect is very small, since the brightness
temperature of snow-covered terrain is practically the same as that of forest canopies.
300
look Angle' sr1'
Density of Snow, 03 g/cm'
Diameter of Snow Particle: 1.0 mm
Bottom Rough. RMS = 0.3
~ 250 - - - - - - - - - - - - - - 1 8 V
1 ~-------------18H
:: 200
.. C
DV
:E
~
37H
cD
150 0 ~ ----:100::------'200'-:----=-'300
Woter Equivalent (mm I
519
120
LookAngl", SO"
Horizontal Polarization
100
Density 01 SIlO'" 0. 3 glen·
- - Plane Boundary
- - Bottom Rough. RMS -0.3
80
Q
~60
1.0mm
... "
o.1Smm
o.Smm
-20 0
100
200
300
Water Equivalent (mm)
Figure 18.27: (a) Theoretical brightness temperature 0/ dry snow-covered terrain at 18 and 37
GHz as a function 0/ snow water equivalent and (b) theoretical brightness temperature difference
between 18 and 37 GHz, horizontal polarization as a function 0/ snow grain size and water
equivalent (Hallikainen, 1989).
contributions only from the topmost snow layers reach the air and the brightness temperature
does not depend on the thickness or the water equivalent of snow cover.
The effect of liquid water in snow is illustrated in Figure 18.28 for a volumetric content of
2% . The angular behavior of the brightness temperature of wet snow is the same as for dry
snow both at 6 GHz and at 37 GHz. The difference in the absolute level between the dry and
wet case is 10 to 20 K at 6 GHz, whereas it is about 70 K at 37 GHz. Figure 18.29 shows
the variation of the brightness temperature as a function of the liquid water content. Even a
wetness of 1 % is enough to saturate the brightness temperature. The results indicate that it is
difficult to determine the water equivalent of wet snow cover.
18.5.3.1.3 Effect of land-cover categories The spatial resolution of past and present
spaceborne microwave radiometers is so modest that, for each pixel, the measured value is a
contribution from several land-cover categories:
(18.29)
where TBsnow,i and /i are the brightness temperature contribution and the relative fraction of
land-cover category i. Using land-use maps together with SMMR data, the microwave response
to various land-cover categories for snow-covered terrain was determined by Hallikainen and
Jolma (1986). The results show that boreal forests may reduce the response by up to 50%
compared to farmland.
Recent helicopter-borne measurements with a multi-frequency microwave radiometer have provided more accurate information on the effect of land use categories to the brightness temperature of snow-covered terrain (Kurvonen and Hallikainen, 1995a). Figure 18.30 shows the
effect at 35 and 94 GHz. The results suggest that, for dry snow, the effect is the larger the
higher the biomass content is. Pine I and Pine II stand for stem volumes of 50 to 100 m 3 /ha
and 100 to 150 m 3 /ha, respectively. For wet snow, the effect is very small, since the brightness
temperature of snow-covered terrain is practically the same as that of forest canopies.