

514
M. Hallikainen
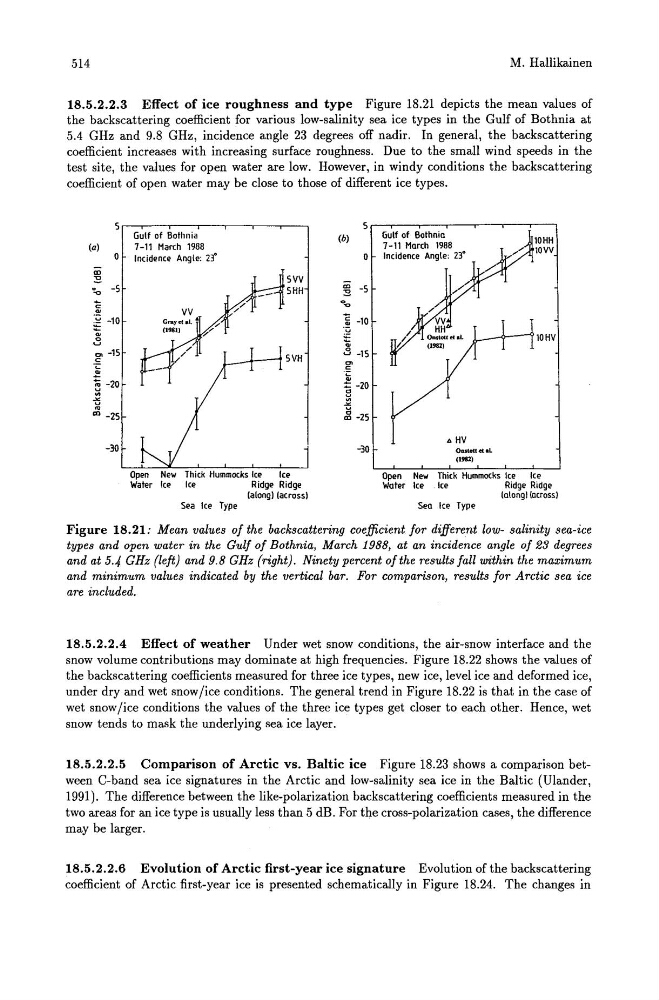
18.5.2.2.3 Effect of ice roughness and type Figure 18.21 depicts the mean values of
the backscattering coefficient for various low-salinity sea ice types in the Gulf of Bothnia at
5.4 GHz and 9.8 GHz, incidence angle 23 degrees off nadir. In general, the backscattering
coefficient increases with increasing surface roughness. Due to the small wind speeds in the
test site, the values for open water are low. However, in windy conditions the backscattering
coefficient of open water may be close to those of different ice types.
(a)
m
~
'!o -5
:;;
~ -10
8
.,. -15
c
.~
~ -20
~ -25
-30
Gulf of Bothnia
7-11 March 1988
Incidence Angle: 23·
5VV
5HH
---,>----r 5 VH
Open New Thick Hummocks Ice
Ice
Water Ice
Ice
Ridge Ridge
(along) (across)
Sea Ice Type
(b)
Gulf of Bothnia
7-11 March 1988
o Incidence Angle: 23·
10HH
lOW
~ -5
] -10
·u
~
8 -15
g0" ..
::: -20
~
~ -25
-30
--<,...---y 10 HV
.. HV
OastottetaL
(1982)
Open New Thick Hummocks Ice
Ice
Water Ice
Ice
Ridge Ridge
(alongl (across)
Sea Ice Type
Figure 18.21: Mean values of the backscattering coefficient for different low- salinity sea-ice
types and open water in the Gulf of Bothnia, March 1988, at an incidence angle of 23 degrees
and at 5.4 GHz (left) and 9.8 GHz (right). Ninety percent of the results fall within the maximum
and minimum values indicated by the vertical bar. For comparison, results for Arctic sea ice
are included.
18.5.2.2.4 Effect of weather Under wet snow conditions, the air-snow interface and the
snow volume contributions may dominate at high frequencies. Figure 18.22 shows the values of
the backscattering coefficients measured for three ice types, new ice, level ice and deformed ice,
under dry and wet snow lice conditions. The general trend in Figure 18.22 is that in the case of
wet snow lice conditions the values of the three ice types get closer to each other. Hence, wet
snow tends to mask the underlying sea ice layer.
18.5.2.2.5 Comparison of Arctic vs. Baltic ice Figure 18.23 shows a comparison between C-band sea ice signatures in the Arctic and low-salinity sea ice in the Baltic (Ulander,
1991). The difference between the like-polarization backscattering coefficients measured in the
two areas for an ice type is usually less than 5 dB. For the cross-polarization cases, the difference
may be larger.
18.5.2.2.6 Evolution of Arctic first-year ice signature Evolution of the backscattering
coefficient of Arctic first-year ice is presented schematically in Figure 18.24. The changes in