

474
Overcast Transparent
Uniform Stratus Clouds
0.4
a)
Q..
3: 0.3
...l
~
0.2
00
G
o 00
00
0.1
°0 cP co 0 410 ~og CD
0
~
"0° cr~ s
""
0.0
o
0
'"
0
i~ :1
280
285
290
0.4
b) i
~
0.3
~ 0.2
Ci
o
0
0.1
o ctl°OfIJ "0 0 Ql Oo
0 00
'"
o '8.r~~~~\f~0~~~
::0 0.0
oCD 0 00
0
280
285
290
Mean Infrared Temperature
0.4
0.3
0.2
0.1
0.0
0.4
0.3
0.2
0.1
0.0
Broken Stratocumulus
Clouds
280
..
..
... , .
..
. .
: .. : .
285
290
......
K.B. Katsaros
.: ... ',.. .... , ........... .
.. . - .... -"'''\<4'
280
285
290
Mean Infrared Temperature
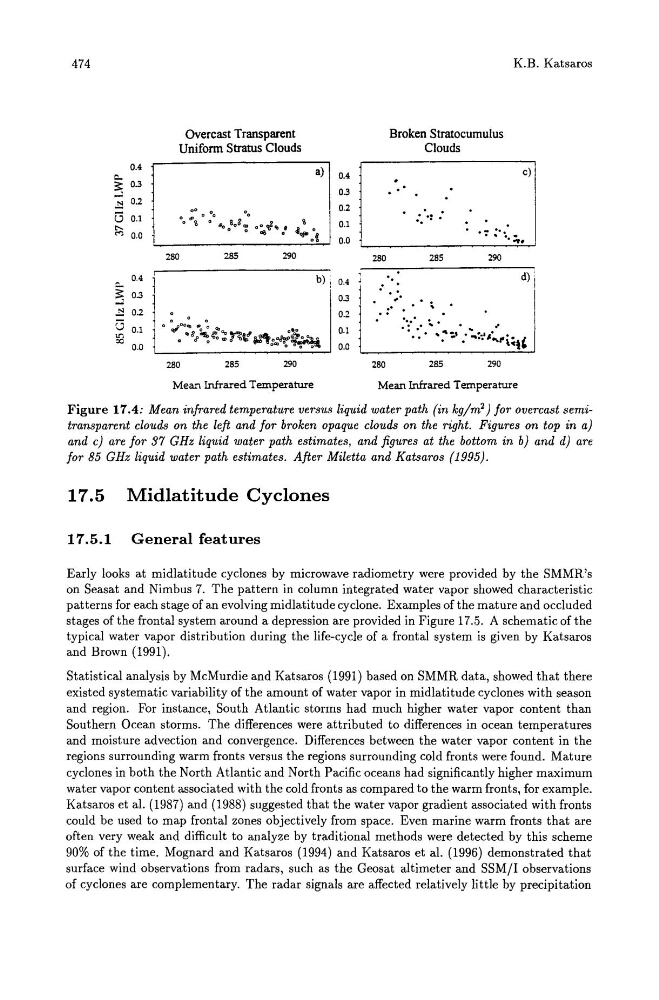
Figure 17.4: Mean infrared temperature versus liquid water path (in kg/m 2 ) for overcast semitransparent clouds on the left and for broken opaque clouds on the right. Figures on top in a)
and c) are for 37 GHz liquid water path estimates, and figures at the bottom in b) and d) are
for 85 GHz liquid water path estimates. After Miletta and Katsaros (1995).
17.5 Midlatitude Cyclones
17.5.1 General features
Early looks at midlatitude cyclones by microwave radiometry were provided by the SMMR's
on Seasat and Nimbus 7. The pattern in column integrated water vapor showed characteristic
patterns for each stage of an evolving midlatitude cyclone. Examples of the mature and occluded
stages of the frontal system around a depression are provided in Figure 17.5. A schematic of the
typical water vapor distribution during the life-cycle of a frontal system is given by Katsaros
and Brown (1991).
Statistical analysis by McMurdie and Katsaros (1991) based on SMMR data, showed that there
existed systematic variability of the amount of water vapor in midlatitude cyclones with season
and region. For instance, South Atlantic storms had much higher water vapor content than
Southern Ocean storms. The differences were attributed to differences in ocean temperatures
and moisture advection and convergence. Differences between the water vapor content in the
regions surrounding warm fronts versus the regions surrounding cold fronts were found. Mature
cyclones in both the North Atlantic and North Pacific oceans had significantly higher maximum
water vapor content associated with the cold fronts as compared to the warm fronts, for example.
Katsaros et al. (1987) and (1988) suggested that the water vapor gradient associated with fronts
could be used to map frontal zones objectively from space. Even marine warm fronts that are
often very weak and difficult to analyze by traditional methods were detected by this scheme
90% of the time. Mognard and Katsaros (1994) and Katsaros et al. (1996) demonstrated that
surface wind observations from radars, such as the Geosat altimeter and SSM/I observations
of cyclones are complementary. The radar signals are affected relatively little by precipitation
Overcast Transparent
Uniform Stratus Clouds
0.4
a)
Q..
3: 0.3
...l
~
0.2
00
G
o 00
00
0.1
°0 cP co 0 410 ~og CD
0
~
"0° cr~ s
""
0.0
o
0
'"
0
i~ :1
280
285
290
0.4
b) i
~
0.3
~ 0.2
Ci
o
0
0.1
o ctl°OfIJ "0 0 Ql Oo
0 00
'"
o '8.r~~~~\f~0~~~
::0 0.0
oCD 0 00
0
280
285
290
Mean Infrared Temperature
0.4
0.3
0.2
0.1
0.0
0.4
0.3
0.2
0.1
0.0
Broken Stratocumulus
Clouds
280
..
..
... , .
..
. .
: .. : .
285
290
......
K.B. Katsaros
.: ... ',.. .... , ........... .
.. . - .... -"'''\<4'
280
285
290
Mean Infrared Temperature
Figure 17.4: Mean infrared temperature versus liquid water path (in kg/m 2 ) for overcast semitransparent clouds on the left and for broken opaque clouds on the right. Figures on top in a)
and c) are for 37 GHz liquid water path estimates, and figures at the bottom in b) and d) are
for 85 GHz liquid water path estimates. After Miletta and Katsaros (1995).
17.5 Midlatitude Cyclones
17.5.1 General features
Early looks at midlatitude cyclones by microwave radiometry were provided by the SMMR's
on Seasat and Nimbus 7. The pattern in column integrated water vapor showed characteristic
patterns for each stage of an evolving midlatitude cyclone. Examples of the mature and occluded
stages of the frontal system around a depression are provided in Figure 17.5. A schematic of the
typical water vapor distribution during the life-cycle of a frontal system is given by Katsaros
and Brown (1991).
Statistical analysis by McMurdie and Katsaros (1991) based on SMMR data, showed that there
existed systematic variability of the amount of water vapor in midlatitude cyclones with season
and region. For instance, South Atlantic storms had much higher water vapor content than
Southern Ocean storms. The differences were attributed to differences in ocean temperatures
and moisture advection and convergence. Differences between the water vapor content in the
regions surrounding warm fronts versus the regions surrounding cold fronts were found. Mature
cyclones in both the North Atlantic and North Pacific oceans had significantly higher maximum
water vapor content associated with the cold fronts as compared to the warm fronts, for example.
Katsaros et al. (1987) and (1988) suggested that the water vapor gradient associated with fronts
could be used to map frontal zones objectively from space. Even marine warm fronts that are
often very weak and difficult to analyze by traditional methods were detected by this scheme
90% of the time. Mognard and Katsaros (1994) and Katsaros et al. (1996) demonstrated that
surface wind observations from radars, such as the Geosat altimeter and SSM/I observations
of cyclones are complementary. The radar signals are affected relatively little by precipitation