

Applications of Passive and Active Microwave Sensors ...
473
After counting the OLS footprints that fall within the boundaries of the SSM/I footprints, the
mean infrared temperature, the mean visible count and a coefficient of variance (the standard
deviation of the mean visible count divided by the mean) are calculated for all SSM/I 37 and
85 GHz footprints. Each OLS pixel is assumed to contribute equally to the mean (Miletta and
Katsaros, 1995).
17.4.4 Liquid water path estimates for stratocumulus clouds in the
azores regIOn
The method described above is applied to a set of DMSP observations of stratocumulus clouds
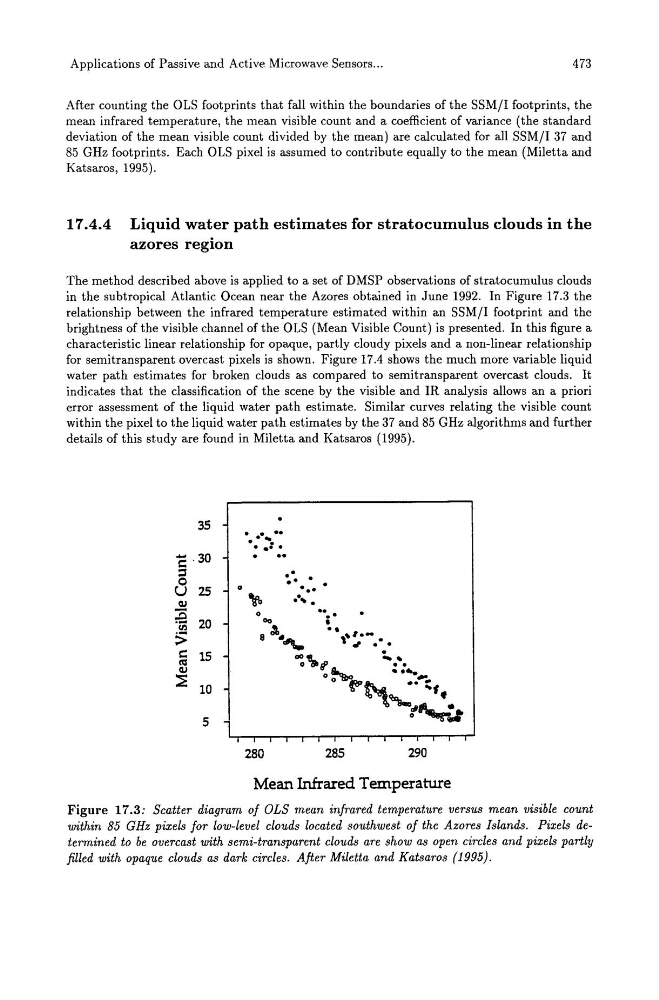
in the subtropical Atlantic Ocean near the Azores obtained in June 1992. In Figure 17.3 the
relationship between the infrared temperature estimated within an SSM/I footprint and the
brightness of the visible channel of the OLS (Mean Visible Count) is presented. In this figure a
characteristic linear relationship for opaque, partly cloudy pixels and a non-linear relationship
for semitransparent overcast pixels is shown. Figure 17.4 shows the much more variable liquid
water path estimates for broken clouds as compared to semitransparent overcast clouds. It
indicates that the classification of the scene by the visible and IR analysis allows an a priori
error assessment of the liquid water path estimate. Similar curves relating the visible count
within the pixel to the liquid water path estimates by the 37 and 85 GHz algorithms and further
details of this study are found in Miletta and Katsaros (1995).
35
"E. 3O
~
0
U 25
o
(1)
;a 20
CI.I
:>
c:: 15
I'CI
(1)
::;E 10
5
. . ..
' ..
. .
.. -.
. ..
.' .' '.,
.-, .
o
••••
00
•
8 ~.
" ,I."\. 'J ... .
280
00«..
... ,
o 7IJt' a:: ...
o~
. .
o
f"~
•• ~f
285
.., W\~"JII... f.
o--rJ
290
Mean Infrared Temperature
Figure 17.3: Scatter diagram of OLS mean infrared temperature versus mean visible count
within 85 GHz pixels for low-level clouds located southwest of the Azores Islands. Pixels determined to be overcast with semi-transparent clouds are show as open circles and pixels partly
filled with opaque clouds as dark circles. After Miletta and Katsaros {1995}.
473
After counting the OLS footprints that fall within the boundaries of the SSM/I footprints, the
mean infrared temperature, the mean visible count and a coefficient of variance (the standard
deviation of the mean visible count divided by the mean) are calculated for all SSM/I 37 and
85 GHz footprints. Each OLS pixel is assumed to contribute equally to the mean (Miletta and
Katsaros, 1995).
17.4.4 Liquid water path estimates for stratocumulus clouds in the
azores regIOn
The method described above is applied to a set of DMSP observations of stratocumulus clouds
in the subtropical Atlantic Ocean near the Azores obtained in June 1992. In Figure 17.3 the
relationship between the infrared temperature estimated within an SSM/I footprint and the
brightness of the visible channel of the OLS (Mean Visible Count) is presented. In this figure a
characteristic linear relationship for opaque, partly cloudy pixels and a non-linear relationship
for semitransparent overcast pixels is shown. Figure 17.4 shows the much more variable liquid
water path estimates for broken clouds as compared to semitransparent overcast clouds. It
indicates that the classification of the scene by the visible and IR analysis allows an a priori
error assessment of the liquid water path estimate. Similar curves relating the visible count
within the pixel to the liquid water path estimates by the 37 and 85 GHz algorithms and further
details of this study are found in Miletta and Katsaros (1995).
35
"E. 3O
~
0
U 25
o
(1)
;a 20
CI.I
:>
c:: 15
I'CI
(1)
::;E 10
5
. . ..
' ..
. .
.. -.
. ..
.' .' '.,
.-, .
o
••••
00
•
8 ~.
" ,I."\. 'J ... .
280
00«..
... ,
o 7IJt' a:: ...
o~
. .
o
f"~
•• ~f
285
.., W\~"JII... f.
o--rJ
290
Mean Infrared Temperature
Figure 17.3: Scatter diagram of OLS mean infrared temperature versus mean visible count
within 85 GHz pixels for low-level clouds located southwest of the Azores Islands. Pixels determined to be overcast with semi-transparent clouds are show as open circles and pixels partly
filled with opaque clouds as dark circles. After Miletta and Katsaros {1995}.