

Satellite Remote Sensing of Evaporation over Sea
8
(C)
6
:![
£4
::l
2
0
1000
800
N" 600
E
~ 400
)(
200
::l
u:: 0
-200
0.6
0.4
(a)
0.2
g
0.0
~
~ .. -\
-0.2
-"
-0.4
,
, .. , ......
-0.6
0
4
8
12
16
20
0
3 February 1993
, -,
4
8
12
16
20
4 February 1993
2
29.B
29.6
29.4 U
a.
29.2 I29.0
28.B
445
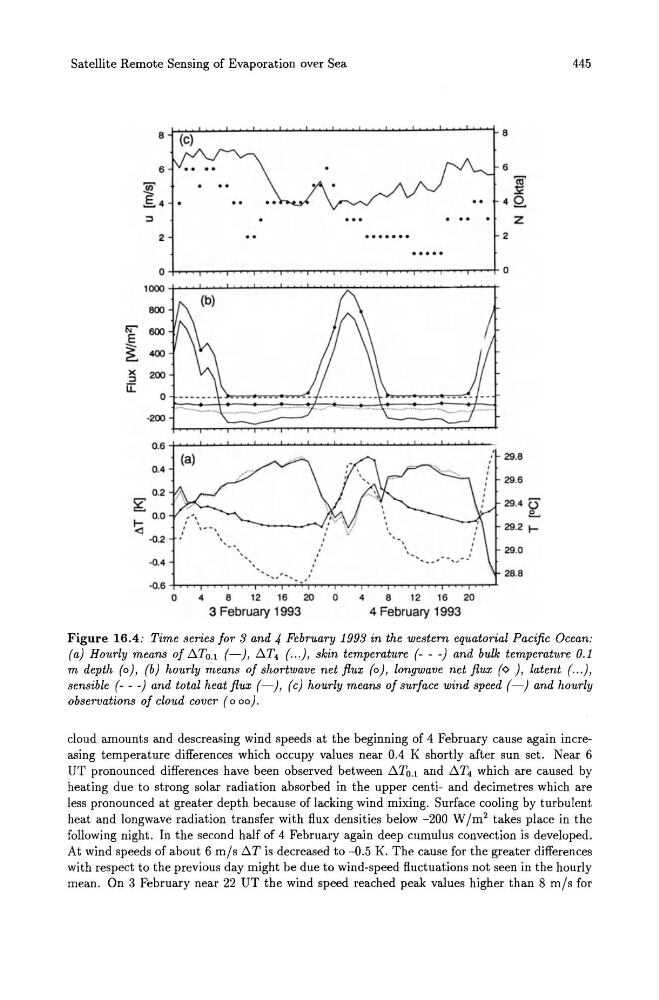
Figure 16.4: Time series for 3 and 4 February 1993 in the western equatorial Pacific Ocean:
(a) Hourly means of ~TO.l (-), ~T4 (. . .), skin temperature (- - -) and bulk temperature 0.1
m depth (0), (b) hourly means of shortwave net flux (0), longwave net flux (0 ), latent ( ... ),
sensible (- - -) and total heat flux (-), (c) hourly means of surface wind speed (-) and hourly
observations of cloud cover (0 00).
cloud amounts and descreasing wind speeds at the beginning of 4 February cause again increasing temperature differences which occupy values near 0.4 K shortly after sun set. Near 6
UT pronounced differences have been observed between ~TO.l and ~T4 which are caused by
heating due to strong solar radiation absorbed in the upper centi- and decimetres which are
less pronounced at greater depth because of lacking wind mixing. Surface cooling by turbulent
heat and longwave radiation transfer with flux densities below -200 W 1m 2 takes place in the
following night . In the second half of 4 February again deep cumulus convection is developed.
At wind speeds of about 6 mls ~T is decreased to -0.5 K. The cause for the greater differences
with respect to the previous day might be due to wind-speed fluctuations not seen in the hourly
mean. On 3 February near 22 UT the wind speed reached peak values higher than 8 mls for
8
(C)
6
:![
£4
::l
2
0
1000
800
N" 600
E
~ 400
)(
200
::l
u:: 0
-200
0.6
0.4
(a)
0.2
g
0.0
~
~ .. -\
-0.2
-"
-0.4
,
, .. , ......
-0.6
0
4
8
12
16
20
0
3 February 1993
, -,
4
8
12
16
20
4 February 1993
2
29.B
29.6
29.4 U
a.
29.2 I29.0
28.B
445
Figure 16.4: Time series for 3 and 4 February 1993 in the western equatorial Pacific Ocean:
(a) Hourly means of ~TO.l (-), ~T4 (. . .), skin temperature (- - -) and bulk temperature 0.1
m depth (0), (b) hourly means of shortwave net flux (0), longwave net flux (0 ), latent ( ... ),
sensible (- - -) and total heat flux (-), (c) hourly means of surface wind speed (-) and hourly
observations of cloud cover (0 00).
cloud amounts and descreasing wind speeds at the beginning of 4 February cause again increasing temperature differences which occupy values near 0.4 K shortly after sun set. Near 6
UT pronounced differences have been observed between ~TO.l and ~T4 which are caused by
heating due to strong solar radiation absorbed in the upper centi- and decimetres which are
less pronounced at greater depth because of lacking wind mixing. Surface cooling by turbulent
heat and longwave radiation transfer with flux densities below -200 W 1m 2 takes place in the
following night . In the second half of 4 February again deep cumulus convection is developed.
At wind speeds of about 6 mls ~T is decreased to -0.5 K. The cause for the greater differences
with respect to the previous day might be due to wind-speed fluctuations not seen in the hourly
mean. On 3 February near 22 UT the wind speed reached peak values higher than 8 mls for