

Remote Sensing Parameterization of Meso-scale ...
419
Latitude
39. 72 mnnmrrmnmmnnmlTTTTmrrnmTTTT1TT1TrmTmnTTTl'l:nmiTT1l~rrmTTTTTTTTTT'TTTrrrmTTTmJ
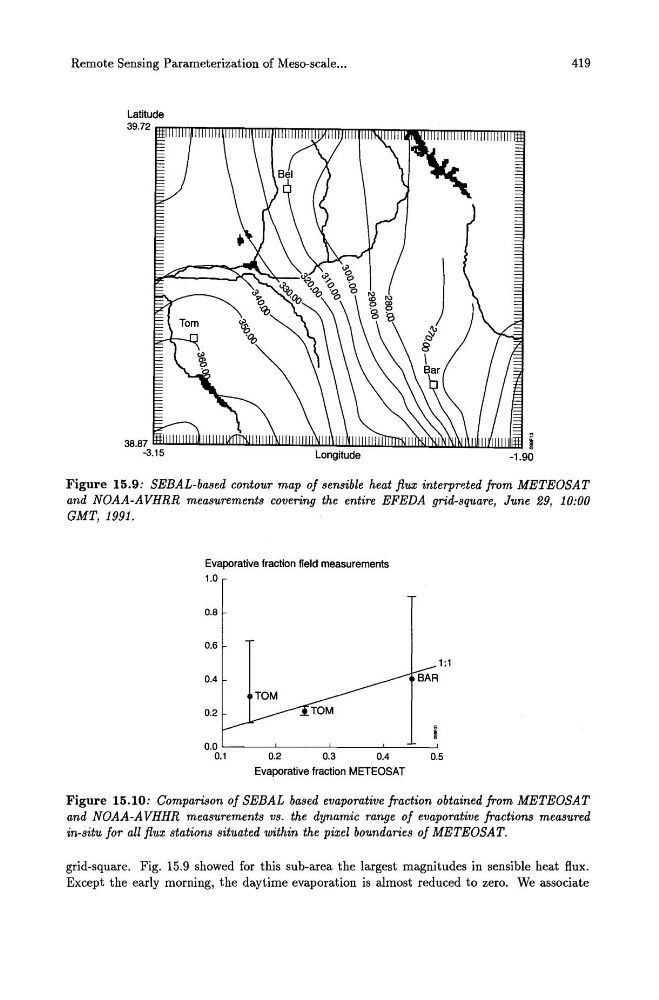
Figure 15.9: SEBAL-based contour map of sensible heat flux interprded from METEOSAT
and NOAA-AVHRR measurements covering the entire EFEDA grid-square, June 29, 10:00
GMT,1991.
Evaporative fraction field measurements
1.0
0.8
0.6
0.4
0.2
1 :1
BAR
0.0 '--------'------'-----'------==-----'
0.1
0.2
0.3
0.4
0.5
Evaporative fraction METEOSAT
Figure 15.10: Comparison of SEBAL based evaporative fraction obtained from METEOSAT
and NOAA-AVHHR measurements vs. the dynamic range of evaporative fractions measured
in-situ for all flux stations situated within the pixel boundaries of METEOSAT.
grid-square. Fig. 15.9 showed for this sub-area the largest magnitudes in sensible heat flux.
Except the early morning, the daytime evaporation is almost reduced to zero. We associate
419
Latitude
39. 72 mnnmrrmnmmnnmlTTTTmrrnmTTTT1TT1TrmTmnTTTl'l:nmiTT1l~rrmTTTTTTTTTT'TTTrrrmTTTmJ
Figure 15.9: SEBAL-based contour map of sensible heat flux interprded from METEOSAT
and NOAA-AVHRR measurements covering the entire EFEDA grid-square, June 29, 10:00
GMT,1991.
Evaporative fraction field measurements
1.0
0.8
0.6
0.4
0.2
1 :1
BAR
0.0 '--------'------'-----'------==-----'
0.1
0.2
0.3
0.4
0.5
Evaporative fraction METEOSAT
Figure 15.10: Comparison of SEBAL based evaporative fraction obtained from METEOSAT
and NOAA-AVHHR measurements vs. the dynamic range of evaporative fractions measured
in-situ for all flux stations situated within the pixel boundaries of METEOSAT.
grid-square. Fig. 15.9 showed for this sub-area the largest magnitudes in sensible heat flux.
Except the early morning, the daytime evaporation is almost reduced to zero. We associate