

418
W.G.M. Bastiaanssen
I.
~
o
SOkm
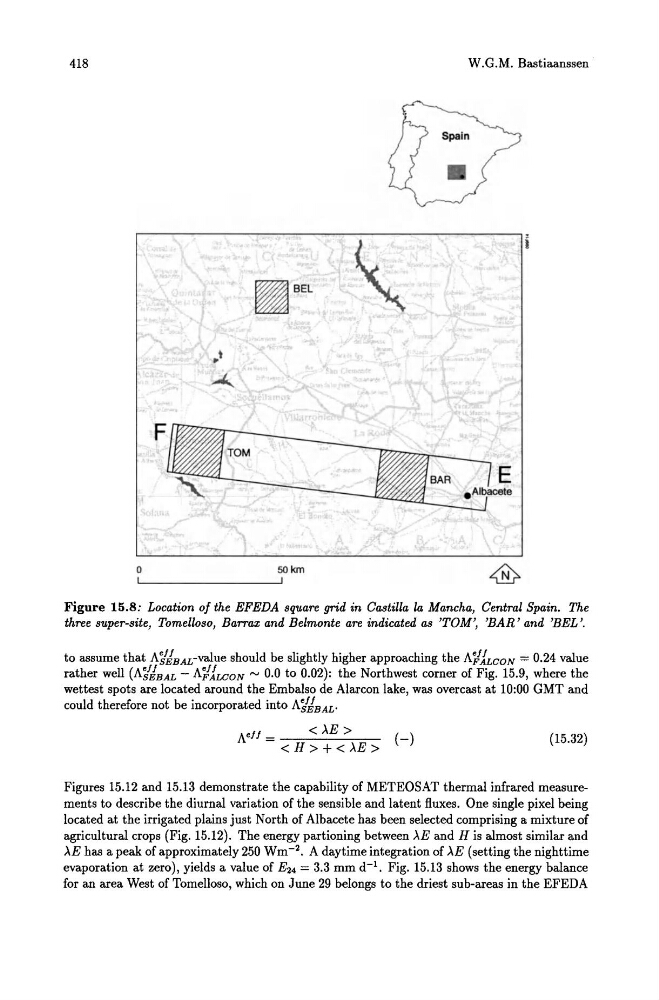
Figure 15.8: Location of the EFEDA square grid in Castilla la Mancha, Central Spain. The
three super-site, Tomelloso, Barrax and Belmonte are indicated as 'TOM', 'BAR' and 'BEL '.
to assume that A11BAL-value should be slightly higher approaching the A,;!lLCoN = 0.24 value
rather well (A11BAL - A,;!lLCoN ~ 0.0 to 0.02): the Northwest corner of Fig. 15.9, where the
wettest spots are located around the Embalso de Alarcon lake, was overcast at 10:00 GMT and
could therefore not be incorporated into A11BAL'
Nf f =
< )"E >
( _ )
< H> +< )"E>
(15.32)
Figures 15.12 and 15.13 demonstrate the capability of METEOSAT thermal infrared measurements to describe the diurnal variation of the sensible and latent fluxes. One single pixel being
located at the irrigated plains just North of Albacete has been selected comprising a mixture of
agricultural crops (Fig. 15.12). The energy partioning between )"E and H is almost similar and
)"E has a peak of approximately 250 Wm- 2 • A daytime integration of )"E (setting the nighttime
evaporation at zero), yields a value of E24 = 3.3 mm d- 1 . Fig. 15.13 shows the energy balance
for an area West of Tomelloso, which on June 29 belongs to the driest sub-areas in the EFEDA
W.G.M. Bastiaanssen
I.
~
o
SOkm
Figure 15.8: Location of the EFEDA square grid in Castilla la Mancha, Central Spain. The
three super-site, Tomelloso, Barrax and Belmonte are indicated as 'TOM', 'BAR' and 'BEL '.
to assume that A11BAL-value should be slightly higher approaching the A,;!lLCoN = 0.24 value
rather well (A11BAL - A,;!lLCoN ~ 0.0 to 0.02): the Northwest corner of Fig. 15.9, where the
wettest spots are located around the Embalso de Alarcon lake, was overcast at 10:00 GMT and
could therefore not be incorporated into A11BAL'
Nf f =
< )"E >
( _ )
< H> +< )"E>
(15.32)
Figures 15.12 and 15.13 demonstrate the capability of METEOSAT thermal infrared measurements to describe the diurnal variation of the sensible and latent fluxes. One single pixel being
located at the irrigated plains just North of Albacete has been selected comprising a mixture of
agricultural crops (Fig. 15.12). The energy partioning between )"E and H is almost similar and
)"E has a peak of approximately 250 Wm- 2 • A daytime integration of )"E (setting the nighttime
evaporation at zero), yields a value of E24 = 3.3 mm d- 1 . Fig. 15.13 shows the energy balance
for an area West of Tomelloso, which on June 29 belongs to the driest sub-areas in the EFEDA