

420
Evaporative fraction (-)
0.7
SebalTM
0.6
0.5
Falcon 20
0.4
0.3
Domier 128
Domier 128
W.O.M. Bastiaanssen
Falcon 20
r r
al
meteo~t
0.1 L--'-_ _ ' - -_ _ -'------''----_-'---'-_ _ L-JLJ
0.2
10 June
15June
20 June
Day
25 June
30 June
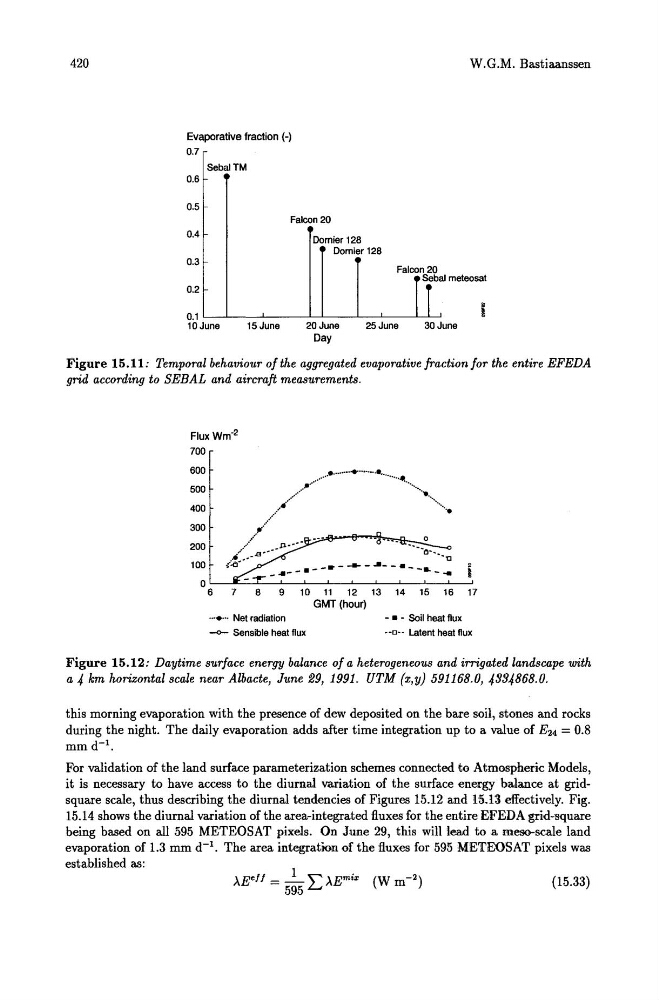
Figure 15.11: Temporal behaviour of the aggregated evaporative fraction for the entire EFEDA
grid according to SEBAL and aircraft measurements.
FluxWm- 2
700
600
500
400
300
200
100
O'---E~L-~--'--~--'--~--'--~--~~
6
7
8
9
10 11
12 13 14 15 16 17
....... Net radiation
- 0 - Sensible heat flux
GMT (hour)
- • - Soil heat flux
- -0-· Latent heat flux
Figure 15.12: Daytime surface energy balance of a heterogeneous and irrigated landscape with
a 4 km horizontal scale near Albacte, June 29, 1991. UTM (x,y) 591168.0, 4994868.0.
this morning evaporation with the presence of dew deposited on the bare soil, stones and rocks
during the night. The daily evaporation adds after time integration up to a value of E24 = 0.8
mmd- l .
For validation of the land surface parameterization schemes connected to Atmospheric Models,
it is necessary to have access to the diurnal variation of the surface energy balance at gridsquare scale, thus describing the diurnal tendencies of Figures 15.12 and 15.13 effectively. Fig.
15.14 shows the diurnal variation of the area-integrated fluxes for the entire EFEDA grid-square
being based on all 595 METEOSAT pixels. On June 29, this will lead to a meso-scale land
evaporation of 1.3 mm d- l . The area integration of the fluxes for 595 METEOSAT pixels was
established as:
>"Eeff = _1_ L >"Emi:z;
595
(15.33)
Evaporative fraction (-)
0.7
SebalTM
0.6
0.5
Falcon 20
0.4
0.3
Domier 128
Domier 128
W.O.M. Bastiaanssen
Falcon 20
r r
al
meteo~t
0.1 L--'-_ _ ' - -_ _ -'------''----_-'---'-_ _ L-JLJ
0.2
10 June
15June
20 June
Day
25 June
30 June
Figure 15.11: Temporal behaviour of the aggregated evaporative fraction for the entire EFEDA
grid according to SEBAL and aircraft measurements.
FluxWm- 2
700
600
500
400
300
200
100
O'---E~L-~--'--~--'--~--'--~--~~
6
7
8
9
10 11
12 13 14 15 16 17
....... Net radiation
- 0 - Sensible heat flux
GMT (hour)
- • - Soil heat flux
- -0-· Latent heat flux
Figure 15.12: Daytime surface energy balance of a heterogeneous and irrigated landscape with
a 4 km horizontal scale near Albacte, June 29, 1991. UTM (x,y) 591168.0, 4994868.0.
this morning evaporation with the presence of dew deposited on the bare soil, stones and rocks
during the night. The daily evaporation adds after time integration up to a value of E24 = 0.8
mmd- l .
For validation of the land surface parameterization schemes connected to Atmospheric Models,
it is necessary to have access to the diurnal variation of the surface energy balance at gridsquare scale, thus describing the diurnal tendencies of Figures 15.12 and 15.13 effectively. Fig.
15.14 shows the diurnal variation of the area-integrated fluxes for the entire EFEDA grid-square
being based on all 595 METEOSAT pixels. On June 29, this will lead to a meso-scale land
evaporation of 1.3 mm d- l . The area integration of the fluxes for 595 METEOSAT pixels was
established as:
>"Eeff = _1_ L >"Emi:z;
595
(15.33)