

412
W.G.M. Bastiaanssen
Day
Location
Hour
n R2 Intercept C4 Slope Ca
local time
(Oe)
ee °e- 1 )
03/09/93 Degraded bush
9:00
5 0.93
33.9
1.24
10:00
5 0.94
27.6
0.98
11:00
5 0.98
30.3
1.01
12:00
5 0.98
27.4
0.91
13:00
5 0.98
29.8
0.95
05/09/93 Fallow bush/
9:00
4 0.89
30.4
1.08
grassland
10:00
4 0.98
28.3
0.99
11:00
4 0.99
30.4
1.01
12:00
4 0.99
31.4
0.99
13:00
4 0.98
34.9
1.04
14:00
4 0.95
38.2
1.09
15:00
4 0.99
40.9
1.14
16:00
4 0.99
37.3
1.06
08/09/93 Fallow bush/
9:00
5 0.97
43.0
1.45
grassland
10:00
5 0.97
32.7
1.08
11:00
5 0.98
28.4
0.92
12:00
5 0.99
28.5
0.89
13:00
5 0.99
30.7
0.93
14:00
5 0.99
33.0
0.98
15:00
5 0.99
33.4
0.98
16:00
5 0.98
35.6
0.98
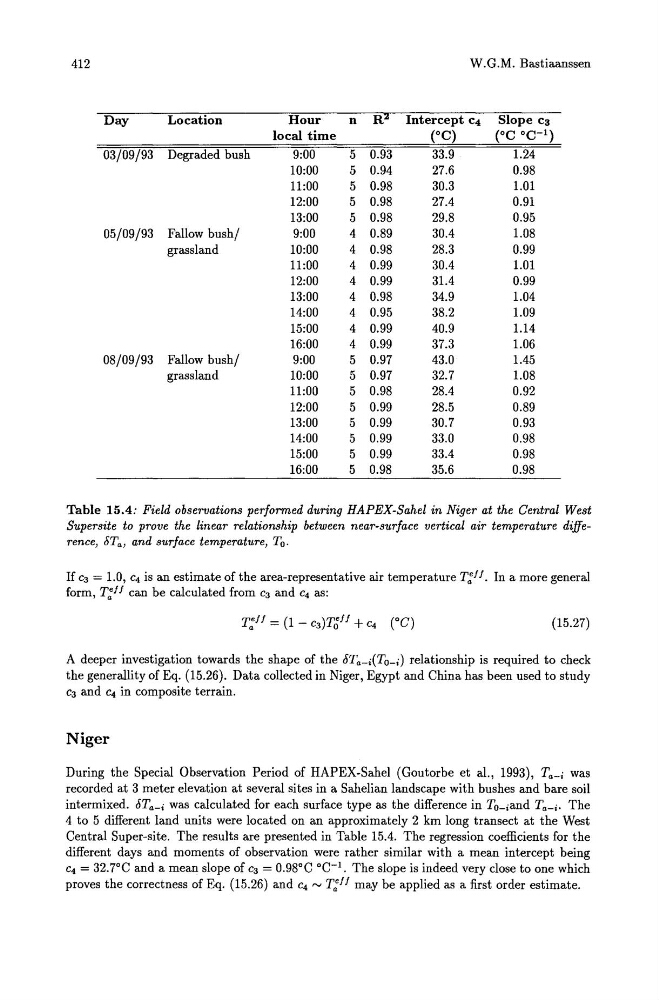
Table 15.4: Field observations performed during HAPEX-Sahel in Niger at the Central West
Supersite to prove the linear relationship between near-surface vertical air temperature difference, 5Ta , and surface temperature, To.
If C3 = 1.0, C4 is an estimate of the area-representative air temperature T:ff. In a more general
form, T:" can be calculated from C3 and C4 as:
(15.27)
A deeper investigation towards the shape of the 6Ta_ i (To_;) relationship is required to check
the generallity of Eq. (15.26). Data collected in Niger, Egypt and China has been used to study
C3 and C4 in composite terrain.
Niger
During the Special Observation Period of HAP EX-Sahel (Goutorbe et al., 1993), Ta- i was
recorded at 3 meter elevation at several sites in a Sahelian landscape with bushes and bare soil
intermixed. 6Ta_ i was calculated for each surface type as the difference in TO_iand Ta- i . The
4 to 5 different land units were located on an approximately 2 km long transect at the West
Central Super-site. The results are presented in Table 15.4. The regression coefficients for the
different days and moments of observation were rather similar with a mean intercept being
C4 = 32.7°C and a mean slope of C3 = 0.98°C °C- 1 • The slope is indeed very close to one which
proves the correctness of Eq. (15.26) and C4 ~ T:ff may be applied as a first order estimate.
W.G.M. Bastiaanssen
Day
Location
Hour
n R2 Intercept C4 Slope Ca
local time
(Oe)
ee °e- 1 )
03/09/93 Degraded bush
9:00
5 0.93
33.9
1.24
10:00
5 0.94
27.6
0.98
11:00
5 0.98
30.3
1.01
12:00
5 0.98
27.4
0.91
13:00
5 0.98
29.8
0.95
05/09/93 Fallow bush/
9:00
4 0.89
30.4
1.08
grassland
10:00
4 0.98
28.3
0.99
11:00
4 0.99
30.4
1.01
12:00
4 0.99
31.4
0.99
13:00
4 0.98
34.9
1.04
14:00
4 0.95
38.2
1.09
15:00
4 0.99
40.9
1.14
16:00
4 0.99
37.3
1.06
08/09/93 Fallow bush/
9:00
5 0.97
43.0
1.45
grassland
10:00
5 0.97
32.7
1.08
11:00
5 0.98
28.4
0.92
12:00
5 0.99
28.5
0.89
13:00
5 0.99
30.7
0.93
14:00
5 0.99
33.0
0.98
15:00
5 0.99
33.4
0.98
16:00
5 0.98
35.6
0.98
Table 15.4: Field observations performed during HAPEX-Sahel in Niger at the Central West
Supersite to prove the linear relationship between near-surface vertical air temperature difference, 5Ta , and surface temperature, To.
If C3 = 1.0, C4 is an estimate of the area-representative air temperature T:ff. In a more general
form, T:" can be calculated from C3 and C4 as:
(15.27)
A deeper investigation towards the shape of the 6Ta_ i (To_;) relationship is required to check
the generallity of Eq. (15.26). Data collected in Niger, Egypt and China has been used to study
C3 and C4 in composite terrain.
Niger
During the Special Observation Period of HAP EX-Sahel (Goutorbe et al., 1993), Ta- i was
recorded at 3 meter elevation at several sites in a Sahelian landscape with bushes and bare soil
intermixed. 6Ta_ i was calculated for each surface type as the difference in TO_iand Ta- i . The
4 to 5 different land units were located on an approximately 2 km long transect at the West
Central Super-site. The results are presented in Table 15.4. The regression coefficients for the
different days and moments of observation were rather similar with a mean intercept being
C4 = 32.7°C and a mean slope of C3 = 0.98°C °C- 1 • The slope is indeed very close to one which
proves the correctness of Eq. (15.26) and C4 ~ T:ff may be applied as a first order estimate.