

Remote Sensing Parameterization of Meso-scale ...
413
Egypt
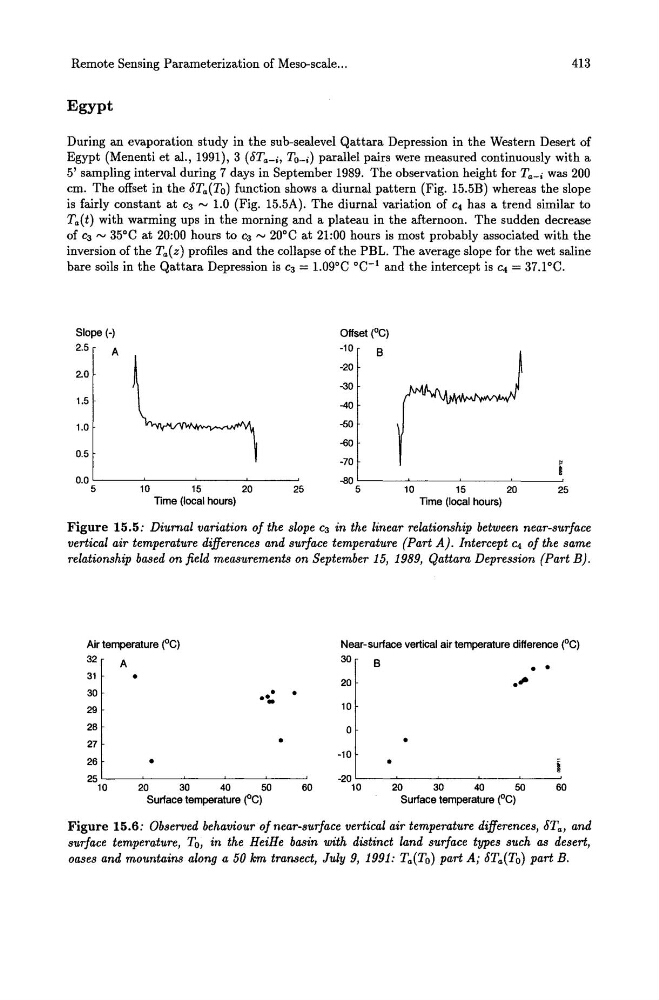
During an evaporation study in the sub-sealevel Qattara Depression in the Western Desert of
Egypt (Menenti et al., 1991), 3 (8Ta-i, TO-i) parallel pairs were measured continuously with a
5' sampling interval during 7 days in September 1989. The observation height for Ta- i was 200
cm. The offset in the 8Ta(To) function shows a diurnal pattern (Fig. 15.5B) whereas the slope
is fairly constant at C3 ~ 1.0 (Fig. 15.5A). The diurnal variation of C4 has a trend similar to
Ta(t) with warming ups in the morning and a plateau in the afternoon. The sudden decrease
of C3 ~ 35°C at 20:00 hours to C3 ~ 20°C at 21:00 hours is most probably associated with the
inversion ofthe Ta(z) profiles and the collapse of the PBL. The average slope for the wet saline
bare soils in the Qattara Depression is C3 = 1.09°C °C- 1 and the intercept is C4 = 37.1°C.
Slope (-)
Offset (0C)
2.5
A
-10
B
2.0
-20
-30
1.5
-40
1.0
-50
-60
0.5
-70
0.0
-80
5
10
15
20
25
5
10
15
20
25
Time (local hours)
Time (local hours)
Figure 15.5: Diurnal variation of the slope C3 in the linear relationship between near-surface
vertical air temperature differences and surface temperature (Part A). Intercept C4 of the same
relationship based on field measurements on September 15, 1989, Qattara Depression (Part B).
Air temperature (0C)
32
31
30
29
28
27
26
A •
•
•
..
-
•
25~--~----~-----L----~--~
10
20
30
40
50
60
Surface temperature (oC)
Near-surface vertical air temperature difference (0C)
30
B
• •
20
.'"
10
o
•
-10
•
-20 L -__ ~ _ _ ~ _ _ ~_~ _ _ ~
10
20
30
40
50
60
Surface temperature (0C)
Figure 15.6: Observed behaviour of near-surface vertical air temperature differences, 8Ta, and
surface temperature, To, in the HeiHe basin with distinct land surface types such as desert,
oases and mountains along a 50 km transect, July 9, 1991: Ta(To) part Ai 8Ta(To) part B.
413
Egypt
During an evaporation study in the sub-sealevel Qattara Depression in the Western Desert of
Egypt (Menenti et al., 1991), 3 (8Ta-i, TO-i) parallel pairs were measured continuously with a
5' sampling interval during 7 days in September 1989. The observation height for Ta- i was 200
cm. The offset in the 8Ta(To) function shows a diurnal pattern (Fig. 15.5B) whereas the slope
is fairly constant at C3 ~ 1.0 (Fig. 15.5A). The diurnal variation of C4 has a trend similar to
Ta(t) with warming ups in the morning and a plateau in the afternoon. The sudden decrease
of C3 ~ 35°C at 20:00 hours to C3 ~ 20°C at 21:00 hours is most probably associated with the
inversion ofthe Ta(z) profiles and the collapse of the PBL. The average slope for the wet saline
bare soils in the Qattara Depression is C3 = 1.09°C °C- 1 and the intercept is C4 = 37.1°C.
Slope (-)
Offset (0C)
2.5
A
-10
B
2.0
-20
-30
1.5
-40
1.0
-50
-60
0.5
-70
0.0
-80
5
10
15
20
25
5
10
15
20
25
Time (local hours)
Time (local hours)
Figure 15.5: Diurnal variation of the slope C3 in the linear relationship between near-surface
vertical air temperature differences and surface temperature (Part A). Intercept C4 of the same
relationship based on field measurements on September 15, 1989, Qattara Depression (Part B).
Air temperature (0C)
32
31
30
29
28
27
26
A •
•
•
..
-
•
25~--~----~-----L----~--~
10
20
30
40
50
60
Surface temperature (oC)
Near-surface vertical air temperature difference (0C)
30
B
• •
20
.'"
10
o
•
-10
•
-20 L -__ ~ _ _ ~ _ _ ~_~ _ _ ~
10
20
30
40
50
60
Surface temperature (0C)
Figure 15.6: Observed behaviour of near-surface vertical air temperature differences, 8Ta, and
surface temperature, To, in the HeiHe basin with distinct land surface types such as desert,
oases and mountains along a 50 km transect, July 9, 1991: Ta(To) part Ai 8Ta(To) part B.