

394
S. Paloscia
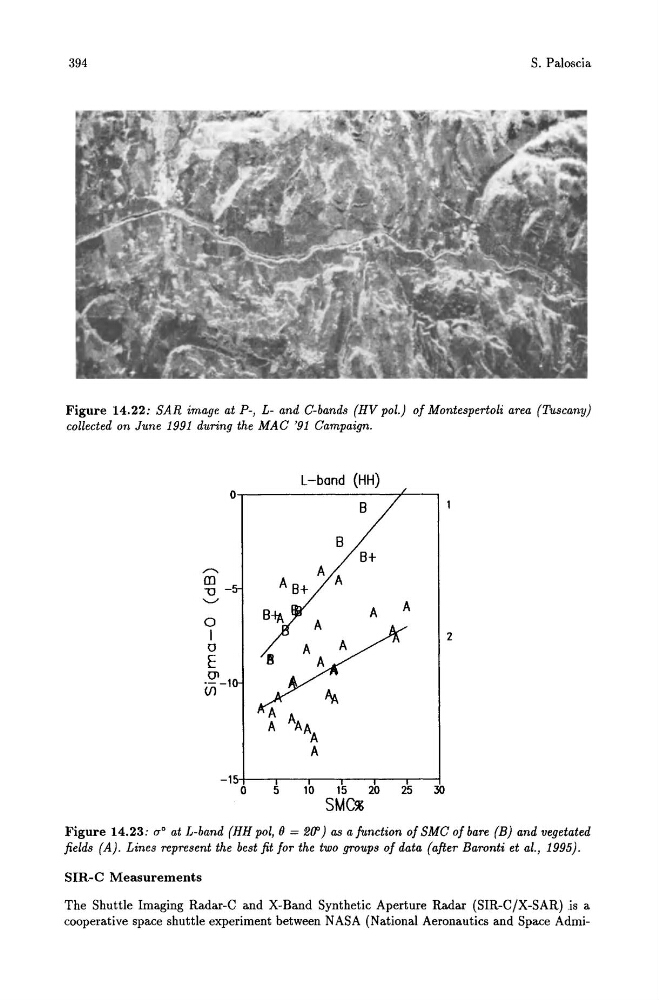
Figure 14.22: SAR image at P-, L- and C-bands (HV pol.) of Montespertoli area (Tuscany)
collected on June 1991 during the MAC '91 Campaign.
L -bond (HH)
O~-----------------?L---,
o
I
o
E
'~-1
(f)
o 5
B
B B+
10
15
20
25
30
SMC%
2
Figure 14.23: (yo at L-band (HH pol, B = 2fJ') as a function of SMC of bare (B) and vegetated
fields (A). Lines represent the best fit for the two groups of data (after Baronti et al., 1995).
SIR-C Measurements
The Shuttle Imaging Radar-C and X-Band Synthetic Aperture Radar (SIR-C/X-SAR) .is a
cooperative space shuttle experiment between NASA (National Aeronautics and Space Admi-
S. Paloscia
Figure 14.22: SAR image at P-, L- and C-bands (HV pol.) of Montespertoli area (Tuscany)
collected on June 1991 during the MAC '91 Campaign.
L -bond (HH)
O~-----------------?L---,
o
I
o
E
'~-1
(f)
o 5
B
B B+
10
15
20
25
30
SMC%
2
Figure 14.23: (yo at L-band (HH pol, B = 2fJ') as a function of SMC of bare (B) and vegetated
fields (A). Lines represent the best fit for the two groups of data (after Baronti et al., 1995).
SIR-C Measurements
The Shuttle Imaging Radar-C and X-Band Synthetic Aperture Radar (SIR-C/X-SAR) .is a
cooperative space shuttle experiment between NASA (National Aeronautics and Space Admi-