

Remote Sensing of Soil Moisture
0.96 . . . - - - - - - - - - - 1 , - - - - - - - - - - ,
Q)
0.92
L
:J
+'
0
L
Q)
Q.
E
III 0.88
I-0
Q)
N
0
E
L
0.84
0
z
0.80 0
I--l MEAN SID
\ 0
* \
\ o
10
20
SMCg (0-5 em)
30
(%)
40
I--l MEAN SID
\
'0
10
20
30
SMCg (0-20 em) (%)
40
383
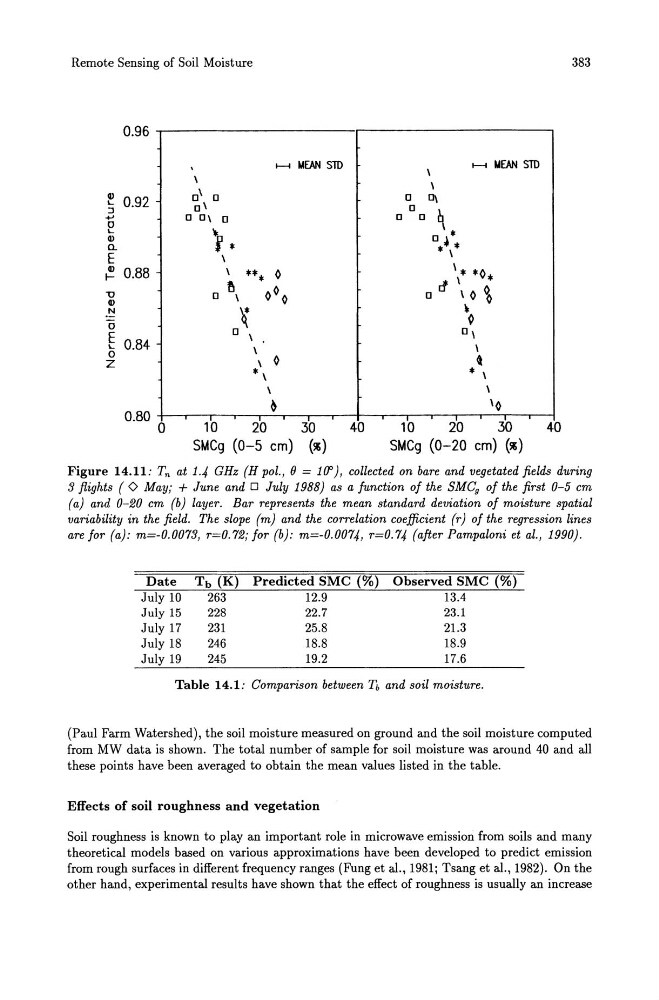
Figure 14.11: Tn at 1.4 GHz (H pol., e = 1(J'), collected on bare and vegetated fields during
3 flights ( <> May; + June and 0 July 1988) as a function of the SMCg of the first 0-5 cm
(aJ and 0-20 cm (bJ layer. Bar represents the mean standard deviation of moisture spatial
variability in the field. The slope (mJ and the correlation coefficient (1') of the regression lines
are for (aJ: m=-0.0073, 1'=0.72; for (b): m=-0.0074, 1'=0.74 (after Pampaloni et al., 1990).
Date
July 10
July 15
July 17
July 18
July 19
263
228
231
246
245
Predicted SMC (%) Observed SMC (%)
12.9
13.4
22.7
25.8
18.8
19.2
23.1
21.3
18.9
17.6
Table 14.1: Comparison between n and soil moisture.
(Paul Farm Watershed), the soil moisture measured on ground and the soil moisture computed
from MW data is shown. The total number of sample for soil moisture was around 40 and all
these points have been averaged to obtain the mean values listed in the table.
Effects of soil roughness and vegetation
Soil roughness is known to play an important role in microwave emission from soils and many
theoretical models based on various approximations have been developed to predict emission
from rough surfaces in different frequency ranges (Fung et al., 1981; Tsang et al., 1982). On the
other hand, experimental results have shown that the effect of roughness is usually an increase
0.96 . . . - - - - - - - - - - 1 , - - - - - - - - - - ,
Q)
0.92
L
:J
+'
0
L
Q)
Q.
E
III 0.88
I-0
Q)
N
0
E
L
0.84
0
z
0.80 0
I--l MEAN SID
\ 0
* \
\ o
10
20
SMCg (0-5 em)
30
(%)
40
I--l MEAN SID
\
'0
10
20
30
SMCg (0-20 em) (%)
40
383
Figure 14.11: Tn at 1.4 GHz (H pol., e = 1(J'), collected on bare and vegetated fields during
3 flights ( <> May; + June and 0 July 1988) as a function of the SMCg of the first 0-5 cm
(aJ and 0-20 cm (bJ layer. Bar represents the mean standard deviation of moisture spatial
variability in the field. The slope (mJ and the correlation coefficient (1') of the regression lines
are for (aJ: m=-0.0073, 1'=0.72; for (b): m=-0.0074, 1'=0.74 (after Pampaloni et al., 1990).
Date
July 10
July 15
July 17
July 18
July 19
263
228
231
246
245
Predicted SMC (%) Observed SMC (%)
12.9
13.4
22.7
25.8
18.8
19.2
23.1
21.3
18.9
17.6
Table 14.1: Comparison between n and soil moisture.
(Paul Farm Watershed), the soil moisture measured on ground and the soil moisture computed
from MW data is shown. The total number of sample for soil moisture was around 40 and all
these points have been averaged to obtain the mean values listed in the table.
Effects of soil roughness and vegetation
Soil roughness is known to play an important role in microwave emission from soils and many
theoretical models based on various approximations have been developed to predict emission
from rough surfaces in different frequency ranges (Fung et al., 1981; Tsang et al., 1982). On the
other hand, experimental results have shown that the effect of roughness is usually an increase