

Remote Sensing of Soil Moisture
379
350
U6
'26
325
T.=263
T.=280
10'.
3'4
~ 275
~ 250
..;
a:
2
'"
,
:!j
#1
Q.
T.=222
I
§
25'4
#10
on 175
T.=206
~
35',
~ 150
l:
'"
iii 125
'"
100
I
-II-TYPICAL FIELD
SALTON SEA
75
T.=96K
LENGTH (400m I
10
15
20
25
30
35
40
OISTANCE. km
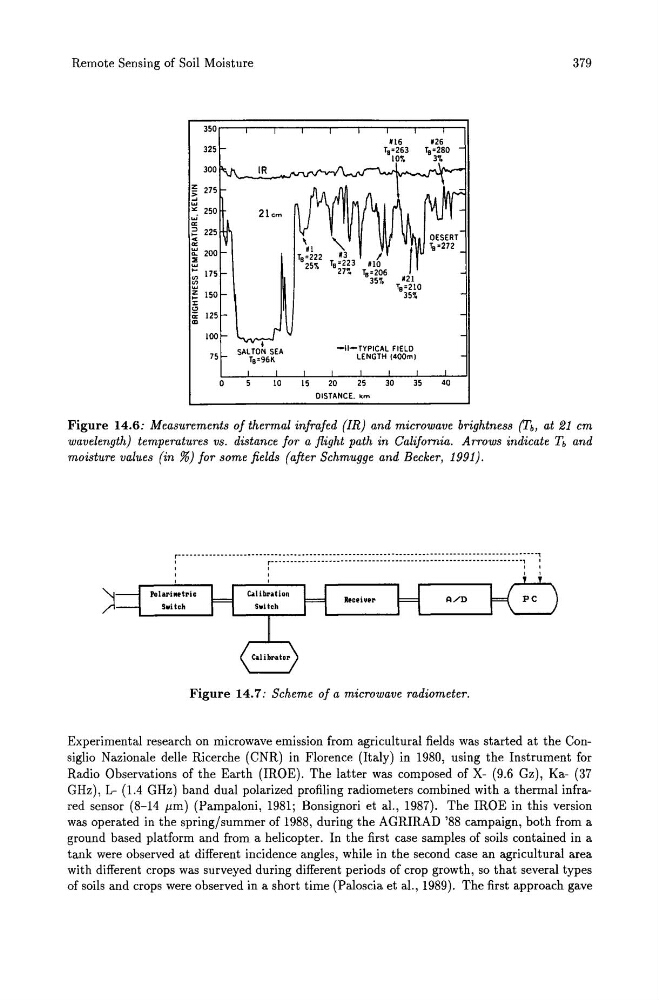
Figure 14.6: Measurements of thermal infrafed (/R) and microwave brightness (Fbi at 21 em
wavelength) temperatures vs. distance for a flight path in California. Arrows indicate nand
moisture values (in %) for some fields (after Schmugge and Becker, 1991).
)
r--------------------------.-.----------------------------------------------------------------,
1
r----------------------------------·_·-·_·------------------------, ,
,
'
, ,
Figure 14.7: Scheme of a microwave radiometer.
Experimental research on microwave emission from agricultural fields was started at the Consiglio Nazionale delle Ricerche (CNR) in Florence (Italy) in 1980, using the Instrument for
Radio Observations of the Earth (IROE). The latter was composed of X- (9.6 Gz), Ka- (37
GHz), L- (1.4 GHz) band dual polarized profiling radiometers combined with a thermal infrared sensor (8-14 11m) (Pampaloni, 1981; Bonsignori et al., 1987). The IROE in this version
was operated in the spring/summer of 1988, during the AGRIRAD '88 campaign, both from a
ground based platform and from a helicopter. In the first case samples of soils contained in a
tank were observed at different incidence angles, while in the second case an agricultural area
with different crops was surveyed during different periods of crop growth, so that several types
of soils and crops were observed in a short time (Paloscia et al., 1989). The first approach gave
379
350
U6
'26
325
T.=263
T.=280
10'.
3'4
~ 275
~ 250
..;
a:
2
'"
,
:!j
#1
Q.
T.=222
I
§
25'4
#10
on 175
T.=206
~
35',
~ 150
l:
'"
iii 125
'"
100
I
-II-TYPICAL FIELD
SALTON SEA
75
T.=96K
LENGTH (400m I
10
15
20
25
30
35
40
OISTANCE. km
Figure 14.6: Measurements of thermal infrafed (/R) and microwave brightness (Fbi at 21 em
wavelength) temperatures vs. distance for a flight path in California. Arrows indicate nand
moisture values (in %) for some fields (after Schmugge and Becker, 1991).
)
r--------------------------.-.----------------------------------------------------------------,
1
r----------------------------------·_·-·_·------------------------, ,
,
'
, ,
Figure 14.7: Scheme of a microwave radiometer.
Experimental research on microwave emission from agricultural fields was started at the Consiglio Nazionale delle Ricerche (CNR) in Florence (Italy) in 1980, using the Instrument for
Radio Observations of the Earth (IROE). The latter was composed of X- (9.6 Gz), Ka- (37
GHz), L- (1.4 GHz) band dual polarized profiling radiometers combined with a thermal infrared sensor (8-14 11m) (Pampaloni, 1981; Bonsignori et al., 1987). The IROE in this version
was operated in the spring/summer of 1988, during the AGRIRAD '88 campaign, both from a
ground based platform and from a helicopter. In the first case samples of soils contained in a
tank were observed at different incidence angles, while in the second case an agricultural area
with different crops was surveyed during different periods of crop growth, so that several types
of soils and crops were observed in a short time (Paloscia et al., 1989). The first approach gave