

380
1.0 .--,.---r--r----r-r--o--r--,--,----,
w
a:
::l
!;t
a:
w
~ 0.9
w
ICJ)
CJ)
w
Z
~ 0.8(!)
a:
[D
o w
o
o
•
•
• A
o t.
Oc
• • .6
o
.
A
~ 0.71- • 1978 DATA
o 1980 DATA
c HIGH-ALTITUDE DATA
A SCHMUGGE ET AL. (1988)
la)
A A
A
w
a:
::l
!;t
a:
w
~ 0.9
w
ICJ)
CJ)
w
o
000
o 0
o
.
•
~ 0.8 c:z:
(!)
a:
[D
o
w
~ 0.7
a:
o
• 1978 DATA
o 1980 DATA
o
o
o •
o
• • •
. .
S. Paloscia
Ib)
a:
o
Z
Z
I
0.6 L-...1........L..-L.---1----JL...-.1.-...l-....L..-L.-.I
0.6 '---'---'--'---'-----I._'---'--....L..---'---'
o 5 10 15 20 25 30 35 40 45 50
0 5 10 15 20 25 30 35 40 45 50
VOLUMETRIC SOIL MOISTURE 0-5 em (%)
VOLUMETRIC SOIL MOISTURE 0-2.5 em (%)
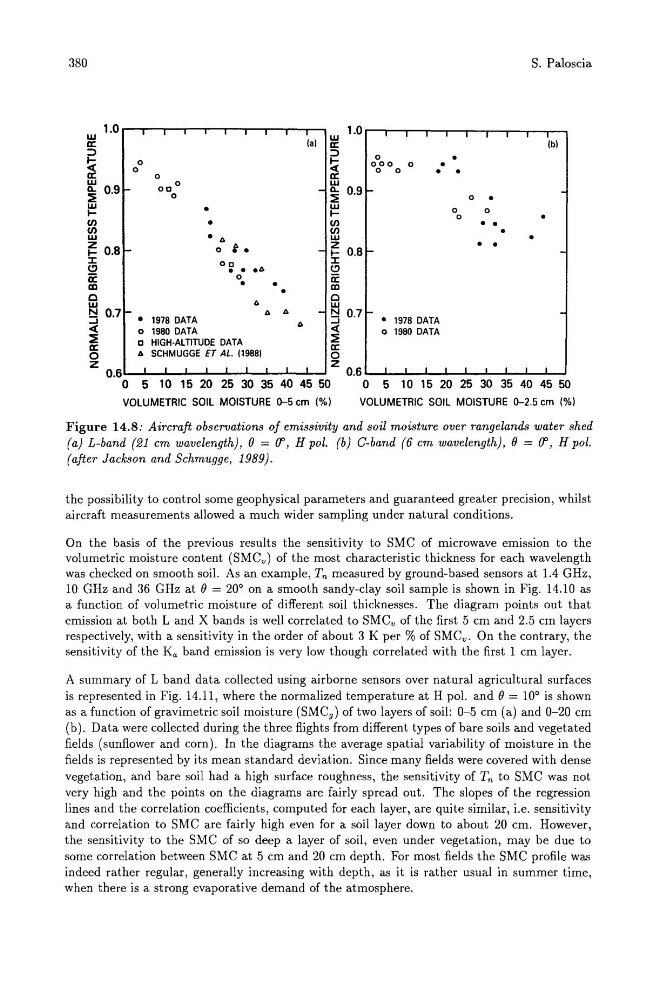
Figure 14.8: Aircraft observations of emissivity and soil moisture over rangelands water shed
(a) L-band (21 cm wavelength), B = (f', H pol. (b) C-band (6 cm wavelength), B = (f', H pol.
(after Jackson and Schmugge, 1989).
the possibility to control some geophysical parameters and guaranteed greater precision, whilst
aircraft measurements allowed a much wider sampling under natural conditions.
On the basis of the previous results the sensitivity to SMC of microwave emission to the
volumetric moisture content (SMCv ) of the most characteristic thickness for each wavelength
was checked on smooth soil. As an example. Tn measured by ground-based sensors at 1.4 GHz,
10 GHz and 36 GHz at B = 20 0 on a smooth sandy-clay soil sample is shown in Fig. 14.10 as
a function of volumetric moisture of different soil thicknesses. The diagram points out that
emission at both L and X bands is well correlated to SMCv of the first 5 cm and 2.5 cm layers
respectively, with a sensitivity in the order of about 3 K per % of SMCv . On the contrary, the
sensitivity of the Ka band emission is very low though correlated with the first 1 cm layer.
A summary of L band data collected using airborne sensors over natural agricultural surfaces
is represented in Fig. 14.11, where the normalized temperature at H pol. and B = 100 is shown
as a function of gravimetric soil moisture (SMC g ) of two layers of soil: 0-5 cm (a) and 0-20 cm
(b). Data were collected during the three flights from different types of bare soils and vegetated
fields (sunflower and corn). In the diagrams the average spatial variability of moisture in the
fields is represented by its mean standard deviation. Since many fields were covered with dense
vegetation, and bare soil had a high surface roughness, the sensitivity of Tn to SMC was not
very high and the points on the diagrams are fairly spread out. The slopes of the regression
lines and the correlation coefficients, computed for each layer, are quite similar, i.e. sensitivity
and correlation to SMC are fairly high even for a soil layer down to about 20 cm. However,
the sensitivity to the SMC of so deep a layer of soil, even under vegetation, may be due to
some correlation between SMC at 5 cm and 20 cm depth. For most fields the SMC profile was
indeed rather regular, generally increasing with depth, as it is rather usual in summer time,
when there is a strong evaporative demand of the atmosphere.
1.0 .--,.---r--r----r-r--o--r--,--,----,
w
a:
::l
!;t
a:
w
~ 0.9
w
ICJ)
CJ)
w
Z
~ 0.8(!)
a:
[D
o w
o
o
•
•
• A
o t.
Oc
• • .6
o
.
A
~ 0.71- • 1978 DATA
o 1980 DATA
c HIGH-ALTITUDE DATA
A SCHMUGGE ET AL. (1988)
la)
A A
A
w
a:
::l
!;t
a:
w
~ 0.9
w
ICJ)
CJ)
w
o
000
o 0
o
.
•
~ 0.8 c:z:
(!)
a:
[D
o
w
~ 0.7
a:
o
• 1978 DATA
o 1980 DATA
o
o
o •
o
• • •
. .
S. Paloscia
Ib)
a:
o
Z
Z
I
0.6 L-...1........L..-L.---1----JL...-.1.-...l-....L..-L.-.I
0.6 '---'---'--'---'-----I._'---'--....L..---'---'
o 5 10 15 20 25 30 35 40 45 50
0 5 10 15 20 25 30 35 40 45 50
VOLUMETRIC SOIL MOISTURE 0-5 em (%)
VOLUMETRIC SOIL MOISTURE 0-2.5 em (%)
Figure 14.8: Aircraft observations of emissivity and soil moisture over rangelands water shed
(a) L-band (21 cm wavelength), B = (f', H pol. (b) C-band (6 cm wavelength), B = (f', H pol.
(after Jackson and Schmugge, 1989).
the possibility to control some geophysical parameters and guaranteed greater precision, whilst
aircraft measurements allowed a much wider sampling under natural conditions.
On the basis of the previous results the sensitivity to SMC of microwave emission to the
volumetric moisture content (SMCv ) of the most characteristic thickness for each wavelength
was checked on smooth soil. As an example. Tn measured by ground-based sensors at 1.4 GHz,
10 GHz and 36 GHz at B = 20 0 on a smooth sandy-clay soil sample is shown in Fig. 14.10 as
a function of volumetric moisture of different soil thicknesses. The diagram points out that
emission at both L and X bands is well correlated to SMCv of the first 5 cm and 2.5 cm layers
respectively, with a sensitivity in the order of about 3 K per % of SMCv . On the contrary, the
sensitivity of the Ka band emission is very low though correlated with the first 1 cm layer.
A summary of L band data collected using airborne sensors over natural agricultural surfaces
is represented in Fig. 14.11, where the normalized temperature at H pol. and B = 100 is shown
as a function of gravimetric soil moisture (SMC g ) of two layers of soil: 0-5 cm (a) and 0-20 cm
(b). Data were collected during the three flights from different types of bare soils and vegetated
fields (sunflower and corn). In the diagrams the average spatial variability of moisture in the
fields is represented by its mean standard deviation. Since many fields were covered with dense
vegetation, and bare soil had a high surface roughness, the sensitivity of Tn to SMC was not
very high and the points on the diagrams are fairly spread out. The slopes of the regression
lines and the correlation coefficients, computed for each layer, are quite similar, i.e. sensitivity
and correlation to SMC are fairly high even for a soil layer down to about 20 cm. However,
the sensitivity to the SMC of so deep a layer of soil, even under vegetation, may be due to
some correlation between SMC at 5 cm and 20 cm depth. For most fields the SMC profile was
indeed rather regular, generally increasing with depth, as it is rather usual in summer time,
when there is a strong evaporative demand of the atmosphere.