

304
P. Joe
~~-------------------------, Eramosa RiverSlue Springs
~
Canagaglque CreeklElmira
~
e'"
~
iii
~~-------------------------, Grand RNerI'MarsvDl.
200
Speed Rlver/Guelph
!
ue100
~
~r---------------------------, Grand RlverMlest Montrose
~
Speed River/Armstrong Mills
!
ue'"
J
aoo,~-------------------------, Grand RNerJCambtldge-G ••
200
Conestoga River/Orayton
- - Measured
- - Computed
~
u.
e100
:
oC-__ ~ ____ - L ____ ~ __ ~~ __ ~
o
40
80
120
160
0
200
0
180
200
120
TIm.
Time
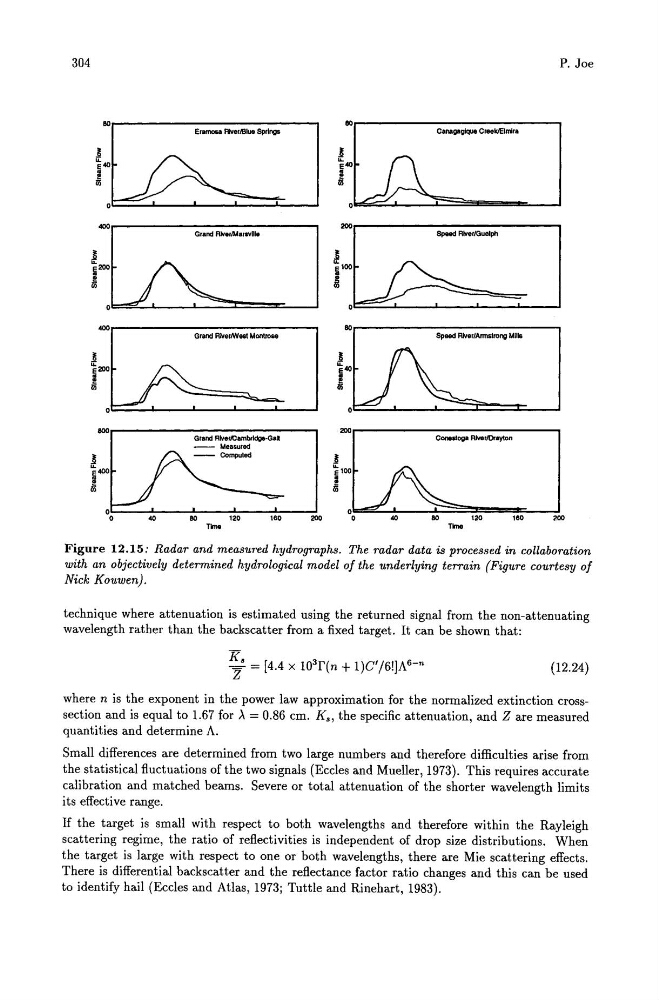
Figure 12.15: Radar and measured hydrographs. The radar data is processed in collaboration
with an objectively determined hydrological model of the underlying terrain (Figure courtesy of
Nick Kouwen).
technique where attenuation is estimated using the returned signal from the non-attenuating
wavelength rather than the backscatter from a fixed target. It can be shown that:
(12.24)
where n is the exponent in the power law approximation for the normalized extinction crosssection and is equal to 1.67 for A = 0.86 cm. K., the specific attenuation, and Z are measured
quantities and determine A.
Small differences are determined from two large numbers and therefore difficulties arise from
the statistical fluctuations of the two signals (Eccles and Mueller, 1973). This requires accurate
calibration and matched beams. Severe or total attenuation of the shorter wavelength limits
its effective range.
If the target is small with respect to both wavelengths and therefore within the Rayleigh
scattering regime, the ratio of reflectivities is independent of drop size distributions. When
the target is large with respect to one or both wavelengths, there are Mie scattering effects.
There is differential backscatter and the reflectance factor ratio changes and this can be used
to identify hail (Eccles and Atlas, 1973; Tuttle and Rinehart, 1983).
P. Joe
~~-------------------------, Eramosa RiverSlue Springs
~
Canagaglque CreeklElmira
~
e'"
~
iii
~~-------------------------, Grand RNerI'MarsvDl.
200
Speed Rlver/Guelph
!
ue100
~
~r---------------------------, Grand RlverMlest Montrose
~
Speed River/Armstrong Mills
!
ue'"
J
aoo,~-------------------------, Grand RNerJCambtldge-G ••
200
Conestoga River/Orayton
- - Measured
- - Computed
~
u.
e100
:
oC-__ ~ ____ - L ____ ~ __ ~~ __ ~
o
40
80
120
160
0
200
0
180
200
120
TIm.
Time
Figure 12.15: Radar and measured hydrographs. The radar data is processed in collaboration
with an objectively determined hydrological model of the underlying terrain (Figure courtesy of
Nick Kouwen).
technique where attenuation is estimated using the returned signal from the non-attenuating
wavelength rather than the backscatter from a fixed target. It can be shown that:
(12.24)
where n is the exponent in the power law approximation for the normalized extinction crosssection and is equal to 1.67 for A = 0.86 cm. K., the specific attenuation, and Z are measured
quantities and determine A.
Small differences are determined from two large numbers and therefore difficulties arise from
the statistical fluctuations of the two signals (Eccles and Mueller, 1973). This requires accurate
calibration and matched beams. Severe or total attenuation of the shorter wavelength limits
its effective range.
If the target is small with respect to both wavelengths and therefore within the Rayleigh
scattering regime, the ratio of reflectivities is independent of drop size distributions. When
the target is large with respect to one or both wavelengths, there are Mie scattering effects.
There is differential backscatter and the reflectance factor ratio changes and this can be used
to identify hail (Eccles and Atlas, 1973; Tuttle and Rinehart, 1983).