

302
P. Joe
6 March 93
40
E'
-S.2
.....
§
0
E
« 10 January 94
~
80
0
c55 60
40
20
8
15
22
29
Day
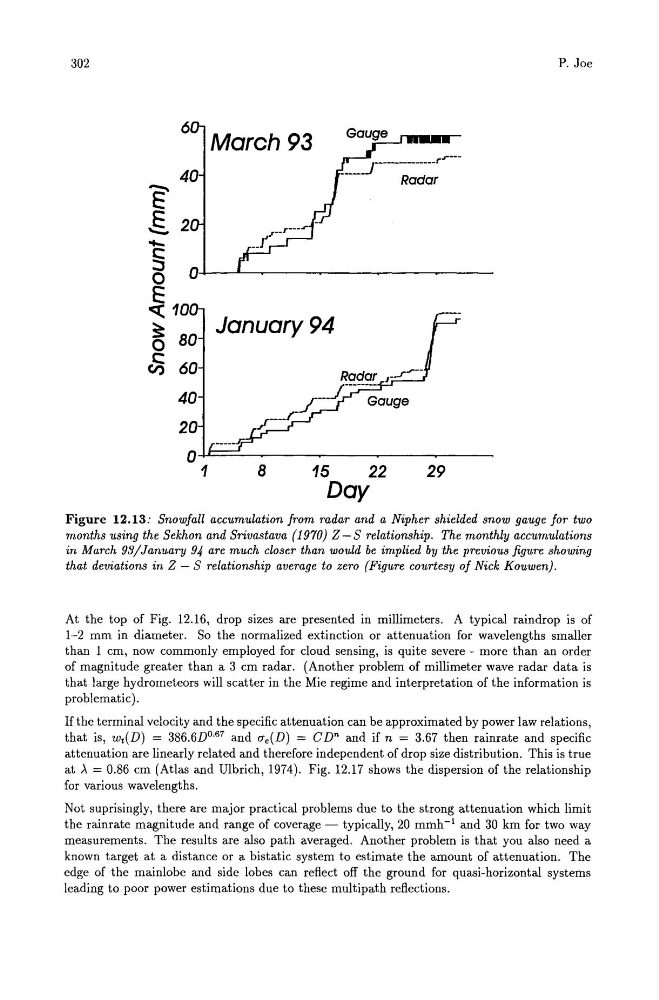
Figure 12.13: Snowfall accumulation from radar and a Nipher shielded snow gauge for two
months using the Sekhon and Srivastava (1970) Z - S relationship. The monthly accumulations
in March 93/January 94 are much closer than would be implied by the previous figure showing
that deviations in Z - S relationship average to zero (Figure courtesy of Nick Kouwen).
At the top of Fig. 12.16, drop sizes are presented in millimeters. A typical raindrop is of
1-2 mm in diameter. So the normalized extinction or attenuation for wavelengths smaller
than 1 cm, now commonly employed for cloud sensing, is quite severe - more than an order
of magnitude greater than a 3 cm radar. (Another problem of millimeter wave radar data is
that large hydrometeors will scatter in the Mie regime and interpretation of the information is
problematic ).
If the terminal velocity and the specific attenuation can be approximated by power law relations,
that is, Wt(D) = 386.6Do. 67 and rre(D) = CDn and if n = 3.67 then rainrate and specific
attenuation are linearly related and therefore independent of drop size distribution. This is true
at A = 0.86 cm (Atlas and Ulbrich, 1974). Fig. 12.17 shows the dispersion of the relationship
for various wavelengths.
Not suprisingly, there are major practical problems due to the strong attenuation which limit
the rainrate magnitude and range of coverage - typically, 20 mmh- 1 and 30 km for two way
measurements. The results are also path averaged. Another problem is that you also need a
known target at a distance or a bistatic system to estimate the amount of attenuation. The
edge of the mainlobe and side lobes can reflect off the ground for quasi-horizontal systems
leading to poor power estimations due to these multipath reflections.
P. Joe
6 March 93
40
E'
-S.2
.....
§
0
E
« 10 January 94
~
80
0
c55 60
40
20
8
15
22
29
Day
Figure 12.13: Snowfall accumulation from radar and a Nipher shielded snow gauge for two
months using the Sekhon and Srivastava (1970) Z - S relationship. The monthly accumulations
in March 93/January 94 are much closer than would be implied by the previous figure showing
that deviations in Z - S relationship average to zero (Figure courtesy of Nick Kouwen).
At the top of Fig. 12.16, drop sizes are presented in millimeters. A typical raindrop is of
1-2 mm in diameter. So the normalized extinction or attenuation for wavelengths smaller
than 1 cm, now commonly employed for cloud sensing, is quite severe - more than an order
of magnitude greater than a 3 cm radar. (Another problem of millimeter wave radar data is
that large hydrometeors will scatter in the Mie regime and interpretation of the information is
problematic ).
If the terminal velocity and the specific attenuation can be approximated by power law relations,
that is, Wt(D) = 386.6Do. 67 and rre(D) = CDn and if n = 3.67 then rainrate and specific
attenuation are linearly related and therefore independent of drop size distribution. This is true
at A = 0.86 cm (Atlas and Ulbrich, 1974). Fig. 12.17 shows the dispersion of the relationship
for various wavelengths.
Not suprisingly, there are major practical problems due to the strong attenuation which limit
the rainrate magnitude and range of coverage - typically, 20 mmh- 1 and 30 km for two way
measurements. The results are also path averaged. Another problem is that you also need a
known target at a distance or a bistatic system to estimate the amount of attenuation. The
edge of the mainlobe and side lobes can reflect off the ground for quasi-horizontal systems
leading to poor power estimations due to these multipath reflections.