

Precipitation at the Ground: Radar Techniques
40
30
R
~
~
~ 20
~ 10
o
• • • •• Aggregates of miscellaneous crystals
+ + + + + Large aggregates of stellars, dendrites
Rimed dendrites, column. needles
0.1
1
10
Precipitation Rate (mm/h)
301
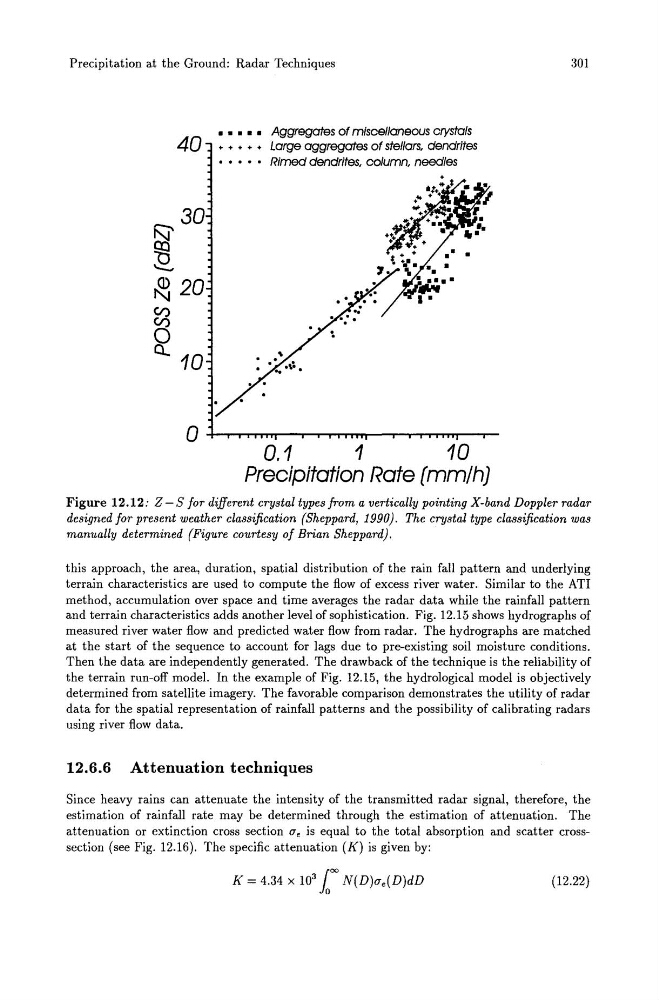
Figure 12.12: Z - S for different crystal types from a vertically pointing X-band Doppler radar
designed for present weather classification (Sheppard, 1990). The crystal type classification was
manually determined (Figure courtesy of Brian Sheppard).
this approach, the area, duration, spatial distribution of the rain fall pattern and underlying
terrain characteristics are used to compute the flow of excess river water. Similar to the ATI
method, accumulation over space and time averages the radar data while the rainfall pattern
and terrain characteristics adds another level of sophistication. Fig. 12.15 shows hydrographs of
measured river water flow and predicted water flow from radar. The hydrographs are matched
at the start of the sequence to account for lags due to pre-existing soil moisture conditions.
Then the data are independently generated. The drawback of the technique is the reliability of
the terrain run-off model. In the example of Fig. 12.15, the hydrological model is objectively
determined from satellite imagery. The favorable comparison demonstrates the utility of radar
data for the spatial representation of rainfall patterns and the possibility of calibrating radars
using river flow data.
12.6.6 Attenuation techniques
Since heavy rains can attenuate the intensity of the transmitted radar signal, therefore, the
estimation of rainfall rate may be determined through the estimation of attenuation. The
attenuation or extinction cross section a e is equal to the total absorption and scatter crosssection (see Fig. 12.16). The specific attenuation (K) is given by:
K = 4.34 x 103100 N(D)ae(D)dD
(12.22)
40
30
R
~
~
~ 20
~ 10
o
• • • •• Aggregates of miscellaneous crystals
+ + + + + Large aggregates of stellars, dendrites
Rimed dendrites, column. needles
0.1
1
10
Precipitation Rate (mm/h)
301
Figure 12.12: Z - S for different crystal types from a vertically pointing X-band Doppler radar
designed for present weather classification (Sheppard, 1990). The crystal type classification was
manually determined (Figure courtesy of Brian Sheppard).
this approach, the area, duration, spatial distribution of the rain fall pattern and underlying
terrain characteristics are used to compute the flow of excess river water. Similar to the ATI
method, accumulation over space and time averages the radar data while the rainfall pattern
and terrain characteristics adds another level of sophistication. Fig. 12.15 shows hydrographs of
measured river water flow and predicted water flow from radar. The hydrographs are matched
at the start of the sequence to account for lags due to pre-existing soil moisture conditions.
Then the data are independently generated. The drawback of the technique is the reliability of
the terrain run-off model. In the example of Fig. 12.15, the hydrological model is objectively
determined from satellite imagery. The favorable comparison demonstrates the utility of radar
data for the spatial representation of rainfall patterns and the possibility of calibrating radars
using river flow data.
12.6.6 Attenuation techniques
Since heavy rains can attenuate the intensity of the transmitted radar signal, therefore, the
estimation of rainfall rate may be determined through the estimation of attenuation. The
attenuation or extinction cross section a e is equal to the total absorption and scatter crosssection (see Fig. 12.16). The specific attenuation (K) is given by:
K = 4.34 x 103100 N(D)ae(D)dD
(12.22)