

Lidar Measurements: Atmospheric Constituents ...
237
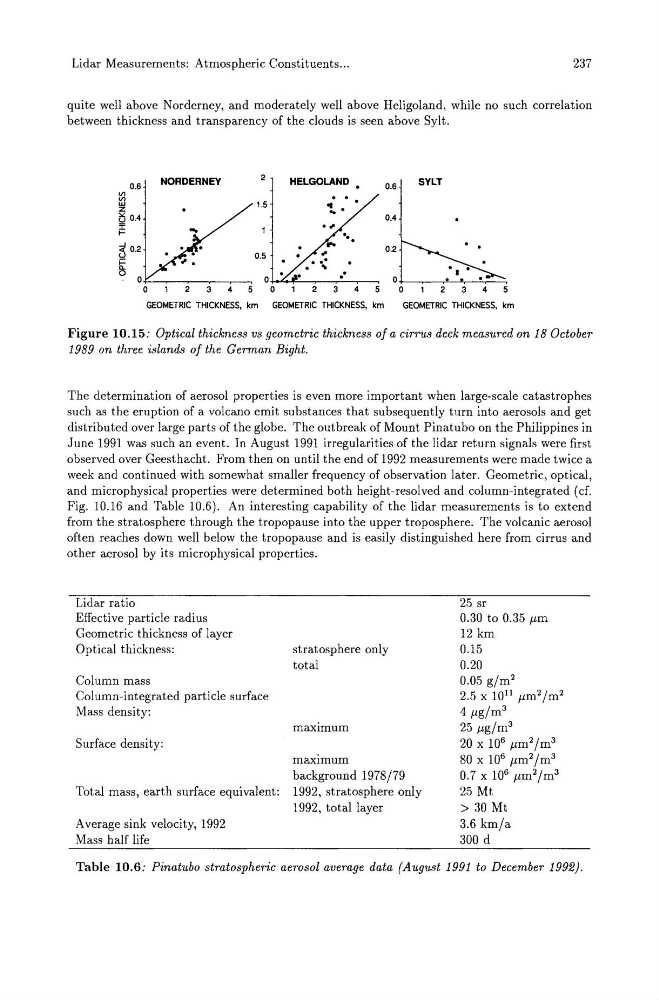
quite well above Norderney, and moderately well above Heligoland, while no such correlation
between thickness and transparency of the clouds is seen above Sylt.
NORDERNEY
2
HELGOLAND
SYLT
0.6
0.6
Vl
0
0
Vl
0
UJ
1.5
'!.o
z
(30.4
0.4
:;:
..
0 '
to
...
00
0.2
u
0.5
,
ii:
o 00
0
...
0
0
0
0
0
2
3
4
5
0
2
4
0
2
4
5
GEOMETRIC THICKNESS, km
GEOMETRIC THICKNESS, km
GEOMETRIC THICKNESS, km
Figure 10.15: Optical thickness vs geometric thickness of a cirrus deck measured on 18 October
1989 on three islands of the German Bight.
The determination of aerosol properties is even more important when large-scale catastrophes
such as the eruption of a volcano emit substances that subsequently turn into aerosols and get
distributed over large parts of the globe. The outbreak of Mount Pinatubo on the Philippines in
June 1991 was such an event. In August 1991 irregularities of the lidar return signals were first
observed over Geesthacht. From then on until the end of 1992 measurements were made twice a
week and continued with somewhat smaller frequency of observation later. Geometric, optical,
and microphysical properties were determined both height-resolved and column-integrated (cf.
Fig. 10.16 and Table 10.6). An interesting capability of the lidar measurements is to extend
from the stratosphere through the tropopause into the upper troposphere. The volcanic aerosol
often reaches down well below the tropopause and is easily distinguished here from cirrus and
other aerosol by its microphysical properties.
Lidar ratio
Effective particle radius
Geometric thickness of layer
Optical thickness:
Column mass
Column-integrated particle surface
Mass density:
Surface density:
Total mass, earth surface equivalent:
A verage sink velocity, 1992
Mass half life
stratosphere only
total
maXImum
maximum
background 1978/79
1992, stratosphere only
1992, total layer
25 sr
0.30 to 0.35 J1m
12 km
0.15
0.20
0.05 g/m 2
2.5 x lOll J1m 2 /m 2
4 J1g/m 3
25 J1g/m 3
20 x 10 6 J1m 2 /m 3
80 x 10 6 J1m 2 /m 3
0.7 x 10 6 fJm 2 /m 3
25 Mt
> 30 Mt
3.6 km/a
300 d
Table 10.6: Pinatubo stratospheric aerosol average data (August 1991 to December 1992).
237
quite well above Norderney, and moderately well above Heligoland, while no such correlation
between thickness and transparency of the clouds is seen above Sylt.
NORDERNEY
2
HELGOLAND
SYLT
0.6
0.6
Vl
0
0
Vl
0
UJ
1.5
'!.o
z
(30.4
0.4
:;:
..
0 '
to
...
00
0.2
u
0.5
,
ii:
o 00
0
...
0
0
0
0
0
2
3
4
5
0
2
4
0
2
4
5
GEOMETRIC THICKNESS, km
GEOMETRIC THICKNESS, km
GEOMETRIC THICKNESS, km
Figure 10.15: Optical thickness vs geometric thickness of a cirrus deck measured on 18 October
1989 on three islands of the German Bight.
The determination of aerosol properties is even more important when large-scale catastrophes
such as the eruption of a volcano emit substances that subsequently turn into aerosols and get
distributed over large parts of the globe. The outbreak of Mount Pinatubo on the Philippines in
June 1991 was such an event. In August 1991 irregularities of the lidar return signals were first
observed over Geesthacht. From then on until the end of 1992 measurements were made twice a
week and continued with somewhat smaller frequency of observation later. Geometric, optical,
and microphysical properties were determined both height-resolved and column-integrated (cf.
Fig. 10.16 and Table 10.6). An interesting capability of the lidar measurements is to extend
from the stratosphere through the tropopause into the upper troposphere. The volcanic aerosol
often reaches down well below the tropopause and is easily distinguished here from cirrus and
other aerosol by its microphysical properties.
Lidar ratio
Effective particle radius
Geometric thickness of layer
Optical thickness:
Column mass
Column-integrated particle surface
Mass density:
Surface density:
Total mass, earth surface equivalent:
A verage sink velocity, 1992
Mass half life
stratosphere only
total
maXImum
maximum
background 1978/79
1992, stratosphere only
1992, total layer
25 sr
0.30 to 0.35 J1m
12 km
0.15
0.20
0.05 g/m 2
2.5 x lOll J1m 2 /m 2
4 J1g/m 3
25 J1g/m 3
20 x 10 6 J1m 2 /m 3
80 x 10 6 J1m 2 /m 3
0.7 x 10 6 fJm 2 /m 3
25 Mt
> 30 Mt
3.6 km/a
300 d
Table 10.6: Pinatubo stratospheric aerosol average data (August 1991 to December 1992).