

236
Laser
Wavelength
Output energy
Repetition rate
Receiver optics
Detectors
Data acquisition system
Maximum count rate
Minimum time-bin width
Number of time bins
XeCl excimer
308 nm
270 mJ
250 Hz
0.80-m afocal Cassegrain
PMT Thorn EMI 9893 ClB 350
3-input-channel multichannel scaler
300 MHz
100 ns
3 x 1024
C. Weitkamp
Table 10.5: Technical data of combined Raman elastic-backscatter lidar.
100
90
~
0
~ 80
Cl
~ 70
:J
:c
w 60
>
i=
:5 50
w
a:
40
30
-40
-45
-50
-55
-60
TEMPERATURE, °C
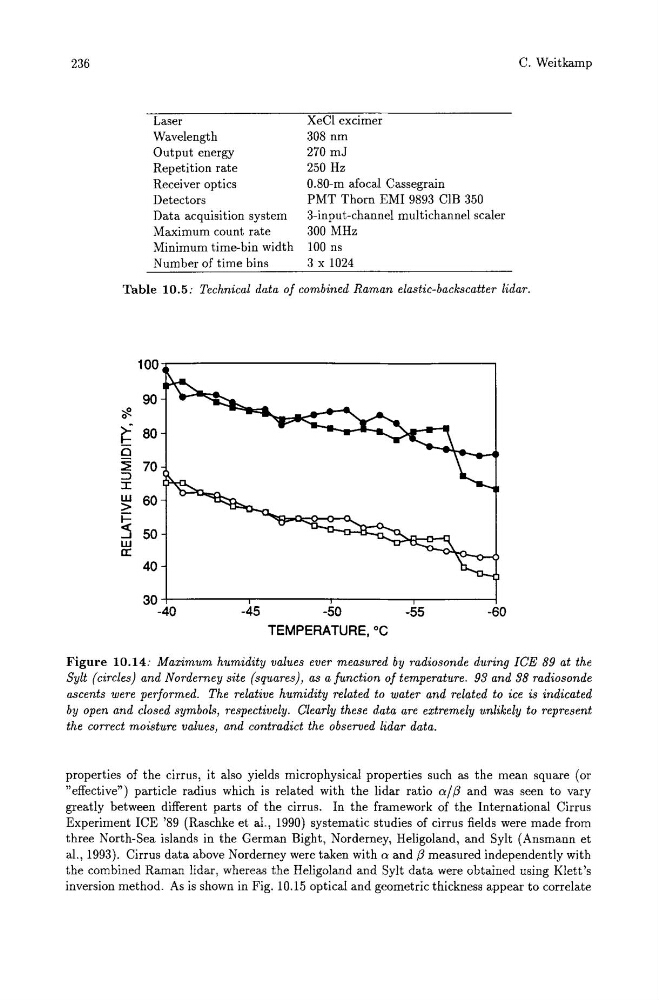
Figure 10.14: Maximum humidity values ever measured by radiosonde during ICE 89 at the
Sylt (circles) and Nordemey site (squares), as a function of temperature. 93 and 38 radiosonde
ascents were performed. The relative humidity related to water and related to ice is indicated
by open and closed symbols, respectively. Clearly these data are extremely unlikely to represent
the correct moisture values, and contradict the observed lidar data.
properties of the cirrus, it also yields microphysical properties such as the mean square (or
"effective") particle radius which is related with the lidar ratio aj f3 and was seen to vary
greatly between different parts of the cirrus. In the framework of the International Cirrus
Experiment ICE '89 (Raschke et al., 1990) systematic studies of cirrus fields were made from
three North-Sea islands in the German Bight, Norderney, Heligoland, and Sylt (Ansmann et
al., 1993). Cirrus data above Norderney were taken with a and f3 measured independently with
the combined Raman lidar, whereas the Heligoland and Sylt data were obtained using Klett's
inversion method. As is shown in Fig. 10.15 optical and geometric thickness appear to correlate
Laser
Wavelength
Output energy
Repetition rate
Receiver optics
Detectors
Data acquisition system
Maximum count rate
Minimum time-bin width
Number of time bins
XeCl excimer
308 nm
270 mJ
250 Hz
0.80-m afocal Cassegrain
PMT Thorn EMI 9893 ClB 350
3-input-channel multichannel scaler
300 MHz
100 ns
3 x 1024
C. Weitkamp
Table 10.5: Technical data of combined Raman elastic-backscatter lidar.
100
90
~
0
~ 80
Cl
~ 70
:J
:c
w 60
>
i=
:5 50
w
a:
40
30
-40
-45
-50
-55
-60
TEMPERATURE, °C
Figure 10.14: Maximum humidity values ever measured by radiosonde during ICE 89 at the
Sylt (circles) and Nordemey site (squares), as a function of temperature. 93 and 38 radiosonde
ascents were performed. The relative humidity related to water and related to ice is indicated
by open and closed symbols, respectively. Clearly these data are extremely unlikely to represent
the correct moisture values, and contradict the observed lidar data.
properties of the cirrus, it also yields microphysical properties such as the mean square (or
"effective") particle radius which is related with the lidar ratio aj f3 and was seen to vary
greatly between different parts of the cirrus. In the framework of the International Cirrus
Experiment ICE '89 (Raschke et al., 1990) systematic studies of cirrus fields were made from
three North-Sea islands in the German Bight, Norderney, Heligoland, and Sylt (Ansmann et
al., 1993). Cirrus data above Norderney were taken with a and f3 measured independently with
the combined Raman lidar, whereas the Heligoland and Sylt data were obtained using Klett's
inversion method. As is shown in Fig. 10.15 optical and geometric thickness appear to correlate