

Properties of Clouds and Cloud Systems
50 JUI."rIU3
,.0
'" '5
~ 440
if
~ 560
(a)
DISTRIBUTION OF CLOUD PROPERTIES
CLOUD OPTICAL THICKNESS
,.0
~ 310
'"
..
~ 440
S ~O
c
125
'.0
! 310
'" . .
~ 440
..
~ 560
(b)
DISTRIBUTION OF ClOUD PROPERTIES
DISTRIBuTION OF CLOUO PROPERTIES
CLOUD OPTICAL THICKNESS
§6.0~------~-,----~------t--iffi
"
CLOUD OPTICAL THICKNESS
(c)
207
120
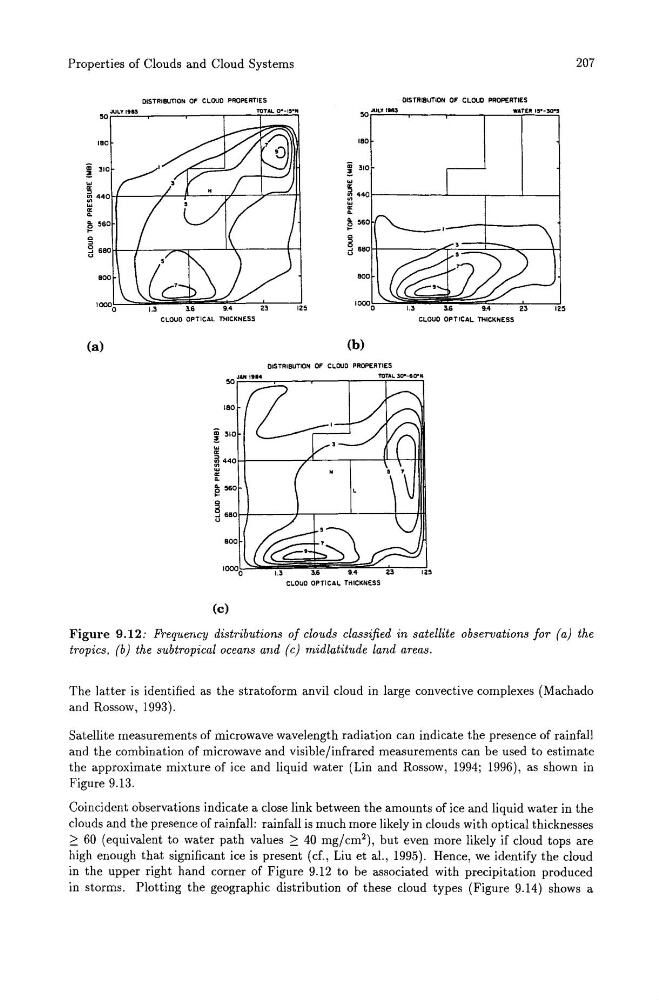
Figure 9.12: Frequency distributions of clouds classified in satellite observations for (a) the
tropics, (b) the subtropical oceans and (c) midlatitude land areas.
The latter is identified as the stratoform anvil cloud in large convective complexes (Machado
and Rossow, 1993).
Satellite measurements of microwave wavelength radiation can indicate the presence of rainfall
and the combination of microwave and visible/infrared measurements can be used to estimate
the approximate mixture of ice and liquid water (Lin and Rossow, 1994; 1996), as shown in
Figure 9.13.
Coincident observations indicate a close link between the amounts of ice and liquid water in the
clouds and the presence of rainfall: rainfall is much more likely in clouds with optical thicknesses
~ 60 (equivalent to water path values ~ 40 mg/cm 2 ), but even more likely if cloud tops are
high enough that significant ice is present (cf., Liu et al., 1995). Hence, we identify the cloud
in the upper right hand corner of Figure 9.12 to be associated with precipitation produced
in storms. Plotting the geographic distribution of these cloud types (Figure 9.14) shows a
50 JUI."rIU3
,.0
'" '5
~ 440
if
~ 560
(a)
DISTRIBUTION OF CLOUD PROPERTIES
CLOUD OPTICAL THICKNESS
,.0
~ 310
'"
..
~ 440
S ~O
c
125
'.0
! 310
'" . .
~ 440
..
~ 560
(b)
DISTRIBUTION OF ClOUD PROPERTIES
DISTRIBuTION OF CLOUO PROPERTIES
CLOUD OPTICAL THICKNESS
§6.0~------~-,----~------t--iffi
"
CLOUD OPTICAL THICKNESS
(c)
207
120
Figure 9.12: Frequency distributions of clouds classified in satellite observations for (a) the
tropics, (b) the subtropical oceans and (c) midlatitude land areas.
The latter is identified as the stratoform anvil cloud in large convective complexes (Machado
and Rossow, 1993).
Satellite measurements of microwave wavelength radiation can indicate the presence of rainfall
and the combination of microwave and visible/infrared measurements can be used to estimate
the approximate mixture of ice and liquid water (Lin and Rossow, 1994; 1996), as shown in
Figure 9.13.
Coincident observations indicate a close link between the amounts of ice and liquid water in the
clouds and the presence of rainfall: rainfall is much more likely in clouds with optical thicknesses
~ 60 (equivalent to water path values ~ 40 mg/cm 2 ), but even more likely if cloud tops are
high enough that significant ice is present (cf., Liu et al., 1995). Hence, we identify the cloud
in the upper right hand corner of Figure 9.12 to be associated with precipitation produced
in storms. Plotting the geographic distribution of these cloud types (Figure 9.14) shows a