

200
W.B. Rossow
10
- --Equator
----- · 30° North
- .- ._._.- 45° North
0.0001
0.0010
Frequency (km· 1 )
(a)
10.00
10.00
0.01 t..... _ _ ~ _ _ _ ~_-'
0. 1
1.0
0.1
1.0
Frequency (days·' )
Frequency (days ·' )
(b)
(e)
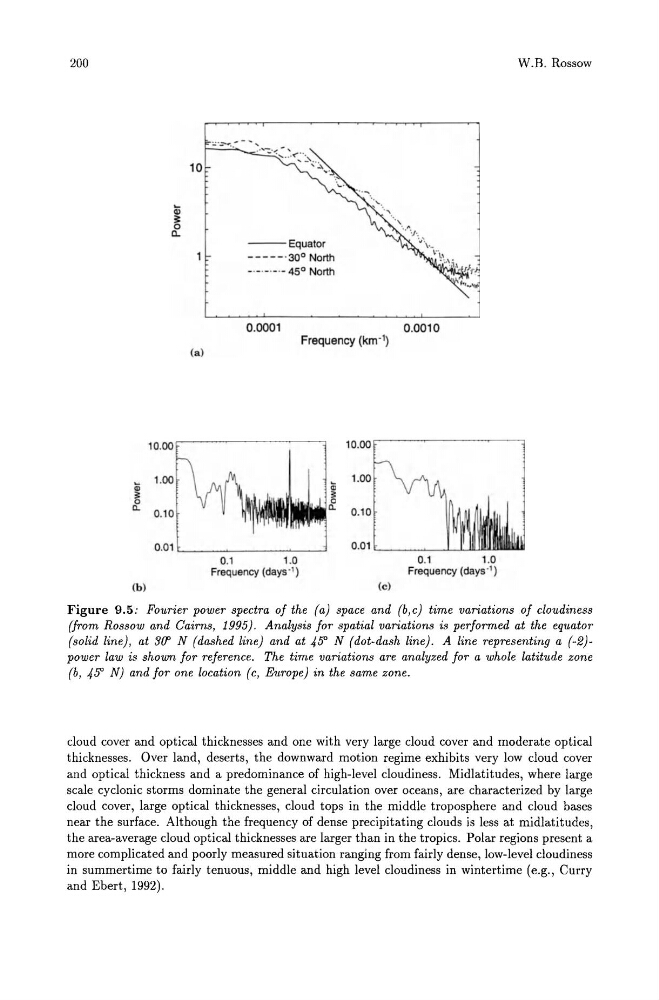
Figure 9.5: Fourier power spectra of the (a) space and (b,c) time variations of cloudiness
(from Rossow and Cairns, 1995). Analysis for spatial variations is performed at the equator
(solid line), at 3(f' N (dashed line) and at 45" N (dot-dash line). A line representing a (-2)power law is shown for reference. The time variations are analyzed for a whole latitude zone
(b, 45" N) and for one location (c, Europe) in the same zone.
cloud cover and optical thicknesses and one with very large cloud cover and moderate optical
thicknesses. Over land, deserts, the downward motion regime exhibits very low cloud cover
and optical thickness and a predominance of high-level cloudiness. Midlatitudes, where large
scale cyclonic storms dominate the general circulation over oceans, are characterized by large
cloud cover, large optical thicknesses, cloud tops in the middle troposphere and cloud bases
near the surface. Although the frequency of dense precipitating clouds is less at midlatitudes,
the area-average cloud optical thicknesses are larger than in the tropics. Polar regions present a
more complicated and poorly measured situation ranging from fairly dense, low-level cloudiness
in summertime to fairly tenuous, middle and high level cloudiness in wintertime (e.g., Curry
and Ebert, 1992).
W.B. Rossow
10
- --Equator
----- · 30° North
- .- ._._.- 45° North
0.0001
0.0010
Frequency (km· 1 )
(a)
10.00
10.00
0.01 t..... _ _ ~ _ _ _ ~_-'
0. 1
1.0
0.1
1.0
Frequency (days·' )
Frequency (days ·' )
(b)
(e)
Figure 9.5: Fourier power spectra of the (a) space and (b,c) time variations of cloudiness
(from Rossow and Cairns, 1995). Analysis for spatial variations is performed at the equator
(solid line), at 3(f' N (dashed line) and at 45" N (dot-dash line). A line representing a (-2)power law is shown for reference. The time variations are analyzed for a whole latitude zone
(b, 45" N) and for one location (c, Europe) in the same zone.
cloud cover and optical thicknesses and one with very large cloud cover and moderate optical
thicknesses. Over land, deserts, the downward motion regime exhibits very low cloud cover
and optical thickness and a predominance of high-level cloudiness. Midlatitudes, where large
scale cyclonic storms dominate the general circulation over oceans, are characterized by large
cloud cover, large optical thicknesses, cloud tops in the middle troposphere and cloud bases
near the surface. Although the frequency of dense precipitating clouds is less at midlatitudes,
the area-average cloud optical thicknesses are larger than in the tropics. Polar regions present a
more complicated and poorly measured situation ranging from fairly dense, low-level cloudiness
in summertime to fairly tenuous, middle and high level cloudiness in wintertime (e.g., Curry
and Ebert, 1992).