

Properties of Clouds and Cloud Systems
ISCCP-C1 April 1988
100.---------------------------~~~------------__.
s
~ 75
~
E
g
'"
Q)
50
S
.8 E 25
:J
z
O+-~~~._~_.~_r~_.~_.~_.~_._._.~~~~
o 100 200 300 400 500 600 700 800 900 1000 1100
Cloud Top Pressure
ISCCP-C1 April 1988
100",--------------------------------------------,
i 75
~ o
.s
~ 50
S
o~
.8 E 25
~O~---~~
o 10 20 30 40 50 60 70 80 90 100 110 120
Cloud Optical Thickness
199
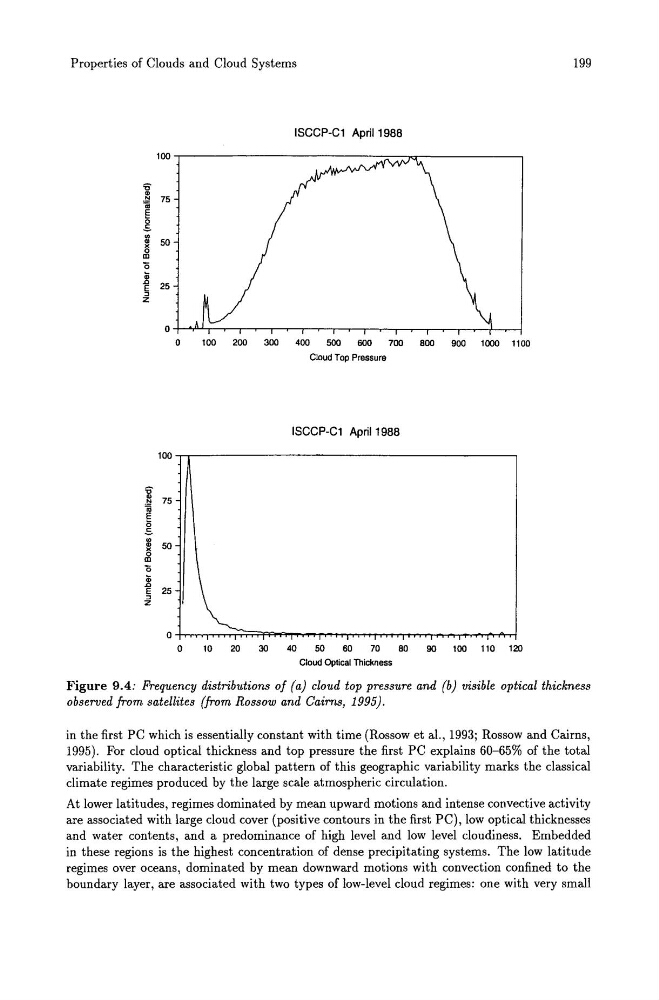
Figure 9.4: Frequency distributions of (a) cloud top pressure and (b) visible optical thickness
observed from satellites (from Rossow and Cairns, 1995).
in the first PC which is essentially constant with time (Rossow et al., 1993; Rossow and Cairns,
1995). For cloud optical thickness and top pressure the first PC explains 60-65% of the total
variability. The characteristic global pattern of this geographic variability marks the classical
climate regimes produced by the large scale atmospheric circulation.
At lower latitudes, regimes dominated by mean upward motions and intense convective activity
are associated with large cloud cover (positive contours in the first PC), low optical thicknesses
and water contents, and a predominance of high level and low level cloudiness. Embedded
in these regions is the highest concentration of dense precipitating systems. The low latitude
regimes over oceans, dominated by mean downward motions with convection confined to the
boundary layer, are associated with two types of low-level cloud regimes: one with very small
ISCCP-C1 April 1988
100.---------------------------~~~------------__.
s
~ 75
~
E
g
'"
Q)
50
S
.8 E 25
:J
z
O+-~~~._~_.~_r~_.~_.~_.~_._._.~~~~
o 100 200 300 400 500 600 700 800 900 1000 1100
Cloud Top Pressure
ISCCP-C1 April 1988
100",--------------------------------------------,
i 75
~ o
.s
~ 50
S
o~
.8 E 25
~O~---~~
o 10 20 30 40 50 60 70 80 90 100 110 120
Cloud Optical Thickness
199
Figure 9.4: Frequency distributions of (a) cloud top pressure and (b) visible optical thickness
observed from satellites (from Rossow and Cairns, 1995).
in the first PC which is essentially constant with time (Rossow et al., 1993; Rossow and Cairns,
1995). For cloud optical thickness and top pressure the first PC explains 60-65% of the total
variability. The characteristic global pattern of this geographic variability marks the classical
climate regimes produced by the large scale atmospheric circulation.
At lower latitudes, regimes dominated by mean upward motions and intense convective activity
are associated with large cloud cover (positive contours in the first PC), low optical thicknesses
and water contents, and a predominance of high level and low level cloudiness. Embedded
in these regions is the highest concentration of dense precipitating systems. The low latitude
regimes over oceans, dominated by mean downward motions with convection confined to the
boundary layer, are associated with two types of low-level cloud regimes: one with very small