

198
'" 30
u
z
'" '" ~ 20
u
u
C>
,..
. .
'" 3Q
u
o •
z
'" 0:
~ 2D
u
u
C>
C> • 0
:>
C>
..J
U
~OJ08(N
9.29 E138.05)
2 3 4 5 I 7 • t ' 0 " .2
HEIGHT ACL (KU)
14(N 30.00 .140.00)
I Z J 4 5 • 1 a 9 1011 11
HEIGHT ACL (KII)
,..
. .
... JO
u
z
...
'" ~ 20
u
u
CI
CI
'" C>
..J
U
W.B. Rossow
22701(N 28.12 .177.23)
o • 2 J 4 5 I 7 • 9 '0" '2
HEIGHT ACL (KII)
. .
......
... 30
u
z
...
'" ~ 20
u
u
C>
Q
' "
CI
..J
·u
2(N 56.30 • 51.00)
o • 2 J 4 5 I 7 • , '0' lIZ
HEIGHT AGL (KU)
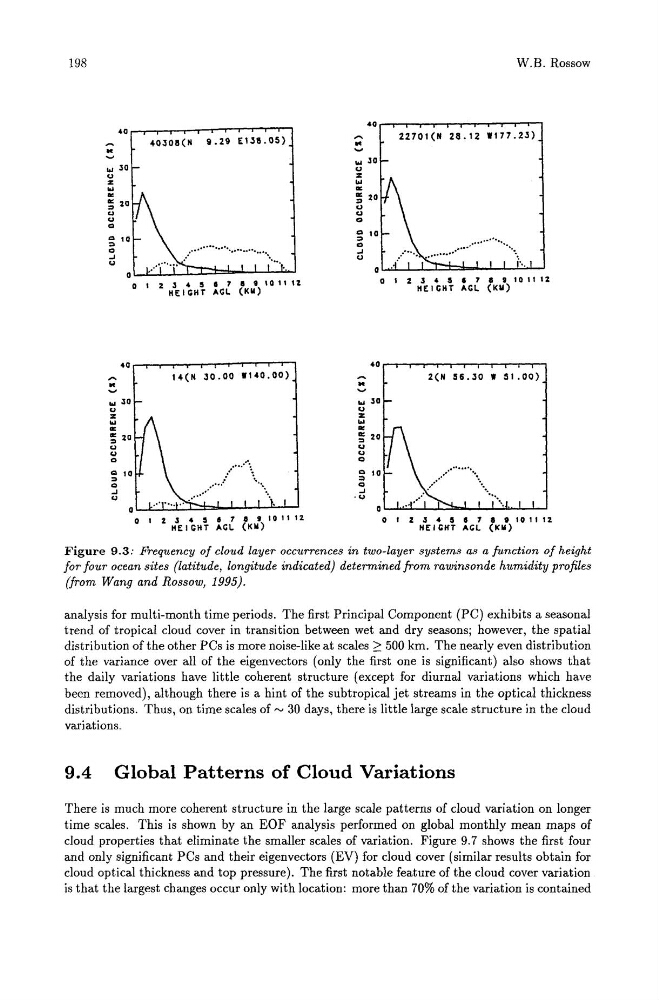
Figure 9.3: Frequency of cloud layer occurrences in two-layer systems as a function of height
for four ocean sites (latitude, longitude indicated) determined from rawinsonde humidity profiles
(from Wang and Rossow, 1995).
analysis for multi-month time periods. The first Principal Component (PC) exhibits a seasonal
trend of tropical cloud cover in transition between wet and dry seasons; however, the spatial
distribution of the other PCs is more noise-like at scales 2' : 500 km. The nearly even distribution
of the variance over all of the eigenvectors (only the first one is significant) also shows that
the daily variations have little coherent structure (except for diurnal variations which have
been removed), although there is a hint of the subtropical jet streams in the optical thickness
distributions. Thus, on time scales of ~ 30 days, there is little large scale structure in the cloud
variations.
9.4 Global Patterns of Cloud Variations
There is much more coherent structure in the large scale patterns of cloud variation on longer
time scales. This is shown by an EOF analysis performed on global monthly mean maps of
cloud properties that eliminate the smaller scales of variation. Figure 9.7 shows the first four
and only significant PCs and their eigenvectors (EV) for cloud cover (similar results obtain for
cloud optical thickness and top pressure). The first notable feature of the cloud cover variation
is that the largest changes occur only with location: more than 70% of the variation is contained
'" 30
u
z
'" '" ~ 20
u
u
C>
,..
. .
'" 3Q
u
o •
z
'" 0:
~ 2D
u
u
C>
C> • 0
:>
C>
..J
U
~OJ08(N
9.29 E138.05)
2 3 4 5 I 7 • t ' 0 " .2
HEIGHT ACL (KU)
14(N 30.00 .140.00)
I Z J 4 5 • 1 a 9 1011 11
HEIGHT ACL (KII)
,..
. .
... JO
u
z
...
'" ~ 20
u
u
CI
CI
'" C>
..J
U
W.B. Rossow
22701(N 28.12 .177.23)
o • 2 J 4 5 I 7 • 9 '0" '2
HEIGHT ACL (KII)
. .
......
... 30
u
z
...
'" ~ 20
u
u
C>
Q
' "
CI
..J
·u
2(N 56.30 • 51.00)
o • 2 J 4 5 I 7 • , '0' lIZ
HEIGHT AGL (KU)
Figure 9.3: Frequency of cloud layer occurrences in two-layer systems as a function of height
for four ocean sites (latitude, longitude indicated) determined from rawinsonde humidity profiles
(from Wang and Rossow, 1995).
analysis for multi-month time periods. The first Principal Component (PC) exhibits a seasonal
trend of tropical cloud cover in transition between wet and dry seasons; however, the spatial
distribution of the other PCs is more noise-like at scales 2' : 500 km. The nearly even distribution
of the variance over all of the eigenvectors (only the first one is significant) also shows that
the daily variations have little coherent structure (except for diurnal variations which have
been removed), although there is a hint of the subtropical jet streams in the optical thickness
distributions. Thus, on time scales of ~ 30 days, there is little large scale structure in the cloud
variations.
9.4 Global Patterns of Cloud Variations
There is much more coherent structure in the large scale patterns of cloud variation on longer
time scales. This is shown by an EOF analysis performed on global monthly mean maps of
cloud properties that eliminate the smaller scales of variation. Figure 9.7 shows the first four
and only significant PCs and their eigenvectors (EV) for cloud cover (similar results obtain for
cloud optical thickness and top pressure). The first notable feature of the cloud cover variation
is that the largest changes occur only with location: more than 70% of the variation is contained