

Properties of Clouds and Cloud Systems
197
are highly concentrated near values of about 5 with a long tail extending beyond 100 (Figure
9.4b). Droplet radii in liquid water clouds show two populations, one near 7-10 11m over land
and a second near 12-15 11m over oceans; however, there are some clouds that exhibit values
greater than 20 11m that usually occur with very large optical thicknesses (Han et aI., 1994).
Liquid water path distributions grow progressively broader going from non-precipitating warm
clouds, through non-precipitating cold clouds and precipitating warm clouds, to precipitating
cold clouds (Lin and Rossow, 1996); but all distributions show some much larger values. Thus,
a typical cloud can be defined by the most frequently occurring characteristics, but there are
a significant number of clouds that have properties far from typical. These two different kinds
of clouds, typical and atypical, can play different roles in the climate, as discussed later.
,...
M
1Z
!oJ
..,
a::
!oJ
a.
~o
LAND
0-10N ( 4~8)
20-30N ( 628)
~0-60N (1370)
"0
70-80N ( 248)
LAYER THICKNESS (KW)
0-10N (1212)
20-30N (2112)
40-~ON ( 791)
~0-60N (
:i6)
"0
70-80N ( 248)
LAYER THICKNESS (KY)
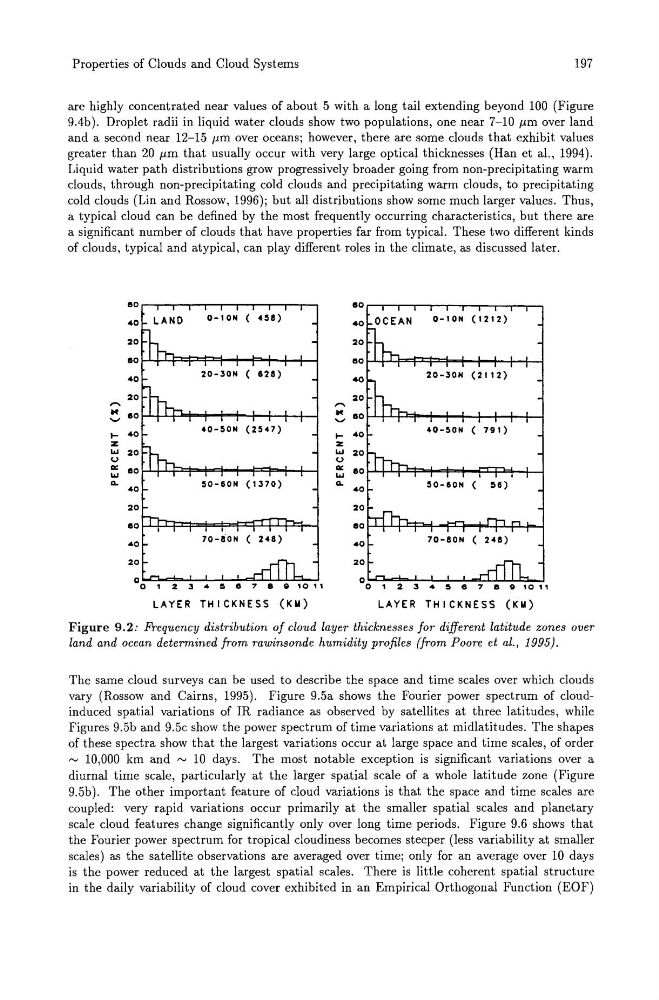
Figure 9.2: Frequency distribution of cloud layer thicknesses for different latitude zones over
land and ocean determined from rawinsonde humidity profiles (from Poore et al., 1995).
The same cloud surveys can be used to describe the space and time scales over which clouds
vary (Rossow and Cairns, 1995). Figure 9.5a shows the Fourier power spectrum of cloudinduced spatial variations of IR radiance as observed by satellites at three latitudes, while
Figures 9.5b and 9.5c show the power spectrum of time variations at midlatitudes. The shapes
of these spectra show that the largest variations occur at large space and time scales, of order
~ 10,000 km and ~ 10 days. The most notable exception is significant variations over a
diurnal time scale, particularly at the larger spatial scale of a whole latitude zone (Figure
9.5b). The other important feature of cloud variations is that the space and time scales are
coupled: very rapid variations occur primarily at the smaller spatial scales and planetary
scale cloud features change significantly only over long time periods. Figure 9.6 shows that
the Fourier power spectrum for tropical cloudiness becomes steeper (less variability at smaller
scales) as the satellite observations are averaged over time; only for an average over 10 days
is the power reduced at the largest spatial scales. There is little coherent spatial structure
in the daily variability of cloud cover exhibited in an Empirical Orthogonal Function (EOF)
197
are highly concentrated near values of about 5 with a long tail extending beyond 100 (Figure
9.4b). Droplet radii in liquid water clouds show two populations, one near 7-10 11m over land
and a second near 12-15 11m over oceans; however, there are some clouds that exhibit values
greater than 20 11m that usually occur with very large optical thicknesses (Han et aI., 1994).
Liquid water path distributions grow progressively broader going from non-precipitating warm
clouds, through non-precipitating cold clouds and precipitating warm clouds, to precipitating
cold clouds (Lin and Rossow, 1996); but all distributions show some much larger values. Thus,
a typical cloud can be defined by the most frequently occurring characteristics, but there are
a significant number of clouds that have properties far from typical. These two different kinds
of clouds, typical and atypical, can play different roles in the climate, as discussed later.
,...
M
1Z
!oJ
..,
a::
!oJ
a.
~o
LAND
0-10N ( 4~8)
20-30N ( 628)
~0-60N (1370)
"0
70-80N ( 248)
LAYER THICKNESS (KW)
0-10N (1212)
20-30N (2112)
40-~ON ( 791)
~0-60N (
:i6)
"0
70-80N ( 248)
LAYER THICKNESS (KY)
Figure 9.2: Frequency distribution of cloud layer thicknesses for different latitude zones over
land and ocean determined from rawinsonde humidity profiles (from Poore et al., 1995).
The same cloud surveys can be used to describe the space and time scales over which clouds
vary (Rossow and Cairns, 1995). Figure 9.5a shows the Fourier power spectrum of cloudinduced spatial variations of IR radiance as observed by satellites at three latitudes, while
Figures 9.5b and 9.5c show the power spectrum of time variations at midlatitudes. The shapes
of these spectra show that the largest variations occur at large space and time scales, of order
~ 10,000 km and ~ 10 days. The most notable exception is significant variations over a
diurnal time scale, particularly at the larger spatial scale of a whole latitude zone (Figure
9.5b). The other important feature of cloud variations is that the space and time scales are
coupled: very rapid variations occur primarily at the smaller spatial scales and planetary
scale cloud features change significantly only over long time periods. Figure 9.6 shows that
the Fourier power spectrum for tropical cloudiness becomes steeper (less variability at smaller
scales) as the satellite observations are averaged over time; only for an average over 10 days
is the power reduced at the largest spatial scales. There is little coherent spatial structure
in the daily variability of cloud cover exhibited in an Empirical Orthogonal Function (EOF)