

196
W.B. Rossow
Microphysics Rank Radiation Rank
Cloud cover
1
1
Liquid/Ice water path
2
2
Layer thickness
2
4
Particle size
3
5
Vertical structure
4
4
Particle size variance
5
6
Top/base height/temperature
6
3
Variance of water content
7
5
Particle shape
8
6
Table 9.2: Cloud properties in order of decreasing significance for microphysical (first number)
and radiative transfer (second number) processes.
COMPARISON OF ISCCP AND SURFACE CLOUD AMOUNTS
100
23
90
80 :-19--'
1
I
1
I
I
I
~ 70:
I
z
I
I
w
I
I
:J 60 I
I
o
I
1
W
1
1
0:
I
I
lL 50:
I
w
I
1
>
1
1
~ 40 l !
..J
I
1
~ 30 i i r-' -
14
I
I
1
20: l!
10 1
!:
I
I
1
I 0 I
I
I
00
10
20
JAN 64, JUL 85, OCT 86
-
Iseep
- - SOBS
30
40
50
60
70
CLOUD AMOUNT (PERCENT)
:--23-1
: ~
I
I
I
1
1
1
I
1
I
I
I
1
I
1
:
l
i
1
I
1
15 1
1
1
I 1
I
I
1
I
I
1
I
I
1
I
1
I
i
i
! 1
100
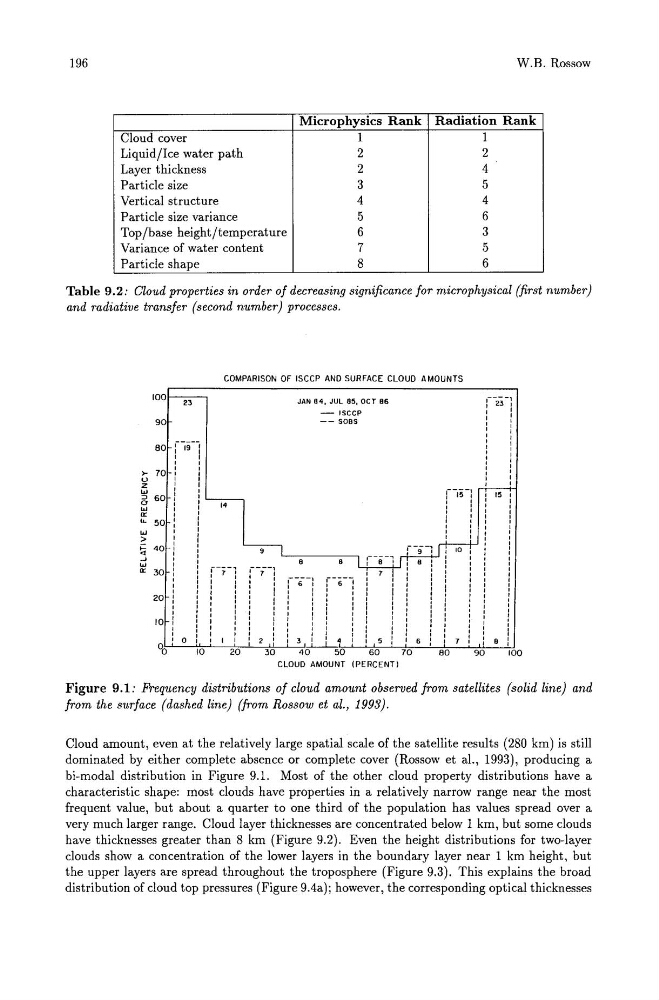
Figure 9.1: Frequency distributions of cloud amount observed from satellites (solid line) and
from the surface (dashed line) (from Rossow et al., 1993).
Cloud amount, even at the relatively large spatial scale of the satellite results (280 km) is still
dominated by either complete absence or complete cover (Rossow et aI., 1993), producing a
hi-modal distribution in Figure 9.1. Most of the other cloud property distributions have a
characteristic shape: most clouds have properties in a relatively narrow range near the most
frequent value, but about a quarter to one third of the population has values spread over a
very much larger range. Cloud layer thicknesses are concentrated below 1 km, but some clouds
have thicknesses greater than 8 km (Figure 9.2). Even the height distributions for two-layer
clouds show a concentration of the lower layers in the boundary layer near 1 km height, but
the upper layers are spread throughout the troposphere (Figure 9.3). This explains the broad
distribution of cloud top pressures (Figure 9.4a); however, the corresponding optical thicknesses
W.B. Rossow
Microphysics Rank Radiation Rank
Cloud cover
1
1
Liquid/Ice water path
2
2
Layer thickness
2
4
Particle size
3
5
Vertical structure
4
4
Particle size variance
5
6
Top/base height/temperature
6
3
Variance of water content
7
5
Particle shape
8
6
Table 9.2: Cloud properties in order of decreasing significance for microphysical (first number)
and radiative transfer (second number) processes.
COMPARISON OF ISCCP AND SURFACE CLOUD AMOUNTS
100
23
90
80 :-19--'
1
I
1
I
I
I
~ 70:
I
z
I
I
w
I
I
:J 60 I
I
o
I
1
W
1
1
0:
I
I
lL 50:
I
w
I
1
>
1
1
~ 40 l !
..J
I
1
~ 30 i i r-' -
14
I
I
1
20: l!
10 1
!:
I
I
1
I 0 I
I
I
00
10
20
JAN 64, JUL 85, OCT 86
-
Iseep
- - SOBS
30
40
50
60
70
CLOUD AMOUNT (PERCENT)
:--23-1
: ~
I
I
I
1
1
1
I
1
I
I
I
1
I
1
:
l
i
1
I
1
15 1
1
1
I 1
I
I
1
I
I
1
I
I
1
I
1
I
i
i
! 1
100
Figure 9.1: Frequency distributions of cloud amount observed from satellites (solid line) and
from the surface (dashed line) (from Rossow et al., 1993).
Cloud amount, even at the relatively large spatial scale of the satellite results (280 km) is still
dominated by either complete absence or complete cover (Rossow et aI., 1993), producing a
hi-modal distribution in Figure 9.1. Most of the other cloud property distributions have a
characteristic shape: most clouds have properties in a relatively narrow range near the most
frequent value, but about a quarter to one third of the population has values spread over a
very much larger range. Cloud layer thicknesses are concentrated below 1 km, but some clouds
have thicknesses greater than 8 km (Figure 9.2). Even the height distributions for two-layer
clouds show a concentration of the lower layers in the boundary layer near 1 km height, but
the upper layers are spread throughout the troposphere (Figure 9.3). This explains the broad
distribution of cloud top pressures (Figure 9.4a); however, the corresponding optical thicknesses