

164
o
Longitude
R. Stuhlmann
95
90
85
80
75
70
30
25
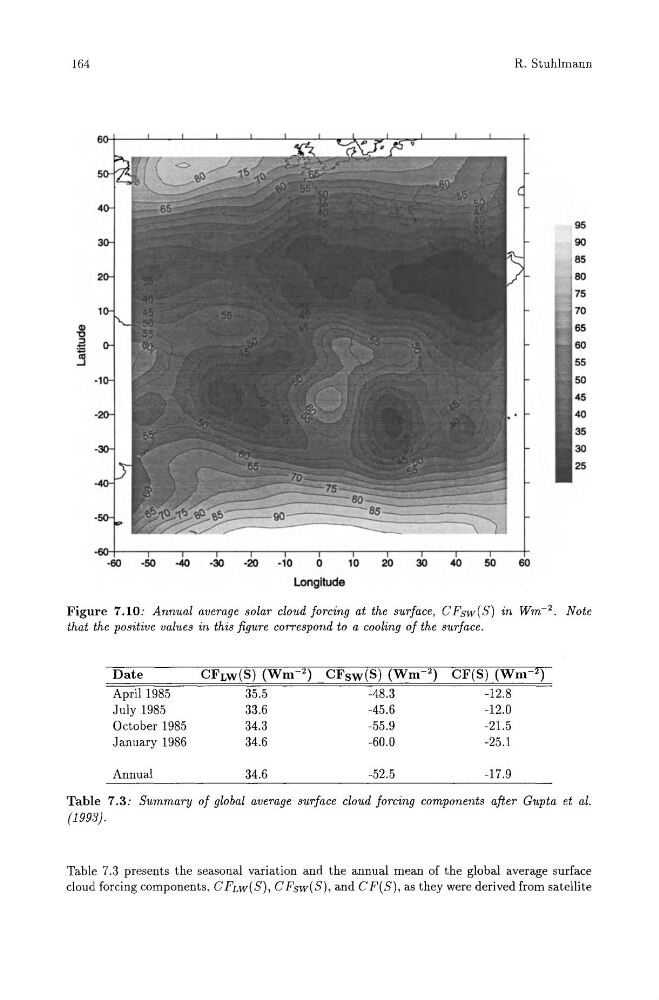
Figure 7.10: Annual average solar cloud forcing at the surface, CFsw(S) ~n Wm- 2 • Note
that the positive values in this figure correspond to a cooling of the surface.
Date
CFLW(S) (Wm 2) CFsw(S) (Wm 2) CF(S) (Wm 2)
April 1985
35.5
-48.3
-12.8
July 1985
33.6
-45.6
-12.0
October 1985
34.3
-55.9
-21.5
January 1986
34.6
-60.0
-25.1
Annual
34.6
-52.5
-17.9
Table 7.3: Summary of global average surface cloud forcing components after Gupta et al.
(1993).
Table 7.3 presents the seasonal variation and the annual mean of the global average surface
cloud forcing components, C FLW(S), C Fsw(S), and C F(S), as they were derived from satellite
o
Longitude
R. Stuhlmann
95
90
85
80
75
70
30
25
Figure 7.10: Annual average solar cloud forcing at the surface, CFsw(S) ~n Wm- 2 • Note
that the positive values in this figure correspond to a cooling of the surface.
Date
CFLW(S) (Wm 2) CFsw(S) (Wm 2) CF(S) (Wm 2)
April 1985
35.5
-48.3
-12.8
July 1985
33.6
-45.6
-12.0
October 1985
34.3
-55.9
-21.5
January 1986
34.6
-60.0
-25.1
Annual
34.6
-52.5
-17.9
Table 7.3: Summary of global average surface cloud forcing components after Gupta et al.
(1993).
Table 7.3 presents the seasonal variation and the annual mean of the global average surface
cloud forcing components, C FLW(S), C Fsw(S), and C F(S), as they were derived from satellite