

Clouds and the Radiative Heating ...
163
80
so
I..o_ve
i"
40
~ 30
f
I
WA¥
......
SOH
- •
-20L-............................................................................ -J
-110 -75 -410-45 - 30 ·1& 0 16 :SO 4& eo 7& eo
LMI1ude
50
26
-'-CIoudForcing
1
-26
· r
-60
... -75
8
-100
j
-125
-I SO
.......
b
- 175
. Q() -75-80 -45 -30 -1 5 0 15 30 45 60 75 eo
Lan.50
_Cloud_Forcing
25
1
f
-25
I
·so
-75
......
J -100
SOH
.......
~
-1 25
.\10 -75-80 -45-30 -1 5 0 15 30 45 60 76 eo
lAtl1ude
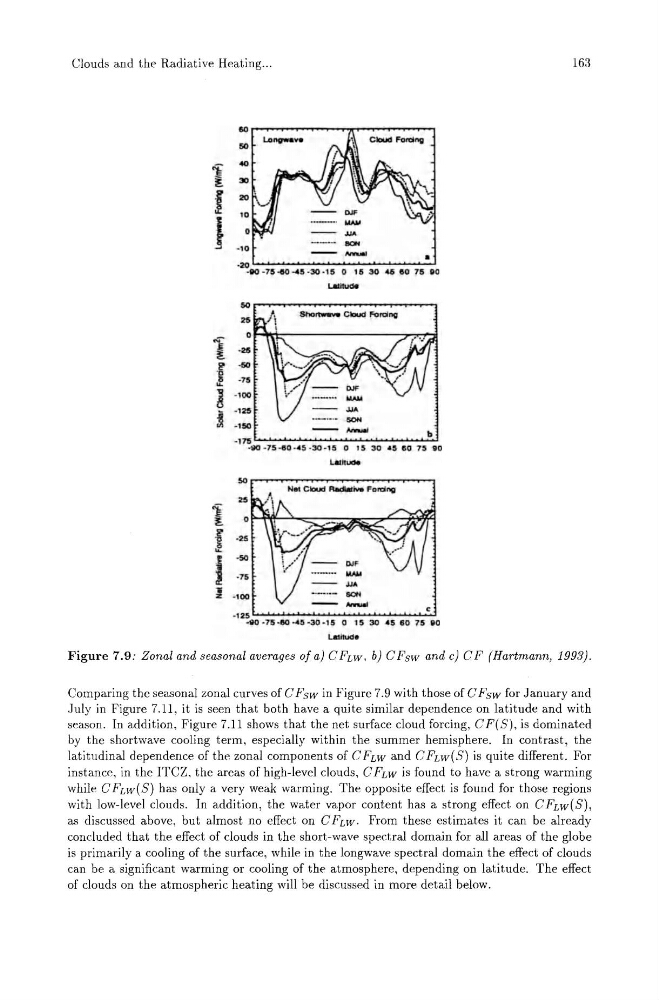
Figure 7.9: Zonal and seasonal averages of a) C FLW , b) C Fsw and c) C F (Hartmann, 1993).
Comparing the seasonal zonal curves of C Fsw in Figure 7.9 with those of C Fsw for January and
July in Figure 7.11, it is seen that both have a quite similar dependence on latitude and with
season. In addition, Figure 7.11 shows that the net surface cloud forcing, CF(S), is dominated
by the shortwave cooling term, especially within the summer hemisphere. In contrast, the
latitudinal dependence of the zonal components of C FLW and C FLW ( S) is quite different. For
instance, in the ITCZ, the areas of high-level clouds, CFLW is found to have a strong warming
while C FLW(S) has only a very weak warming. The opposite effect is found for those regions
with low-level clouds. In addition, the water vapor content has a strong effect on CFLW(S),
as discussed above, but almost no effect on C FLW . From these estimates it can be already
concluded that the effect of clouds in the short-wave spectral domain for all areas of the globe
is primarily a cooling of the surface, while in the longwave spectral domain the effect of clouds
can be a significant warming or cooling of the atmosphere, depending on latitude. The effect
of clouds on the atmospheric heating will be discussed in more detail below.
163
80
so
I..o_ve
i"
40
~ 30
f
I
WA¥
......
SOH
- •
-20L-............................................................................ -J
-110 -75 -410-45 - 30 ·1& 0 16 :SO 4& eo 7& eo
LMI1ude
50
26
-'-CIoudForcing
1
-26
· r
-60
... -75
8
-100
j
-125
-I SO
.......
b
- 175
. Q() -75-80 -45 -30 -1 5 0 15 30 45 60 75 eo
Lan.50
_Cloud_Forcing
25
1
f
-25
I
·so
-75
......
J -100
SOH
.......
~
-1 25
.\10 -75-80 -45-30 -1 5 0 15 30 45 60 76 eo
lAtl1ude
Figure 7.9: Zonal and seasonal averages of a) C FLW , b) C Fsw and c) C F (Hartmann, 1993).
Comparing the seasonal zonal curves of C Fsw in Figure 7.9 with those of C Fsw for January and
July in Figure 7.11, it is seen that both have a quite similar dependence on latitude and with
season. In addition, Figure 7.11 shows that the net surface cloud forcing, CF(S), is dominated
by the shortwave cooling term, especially within the summer hemisphere. In contrast, the
latitudinal dependence of the zonal components of C FLW and C FLW ( S) is quite different. For
instance, in the ITCZ, the areas of high-level clouds, CFLW is found to have a strong warming
while C FLW(S) has only a very weak warming. The opposite effect is found for those regions
with low-level clouds. In addition, the water vapor content has a strong effect on CFLW(S),
as discussed above, but almost no effect on C FLW . From these estimates it can be already
concluded that the effect of clouds in the short-wave spectral domain for all areas of the globe
is primarily a cooling of the surface, while in the longwave spectral domain the effect of clouds
can be a significant warming or cooling of the atmosphere, depending on latitude. The effect
of clouds on the atmospheric heating will be discussed in more detail below.