

162
R. Stuhlmann
Net Cloud Forcing W/m2
-80 -60 -40 -35 -30 -25 -20 -15 -10 -5 0 5 10 15 20
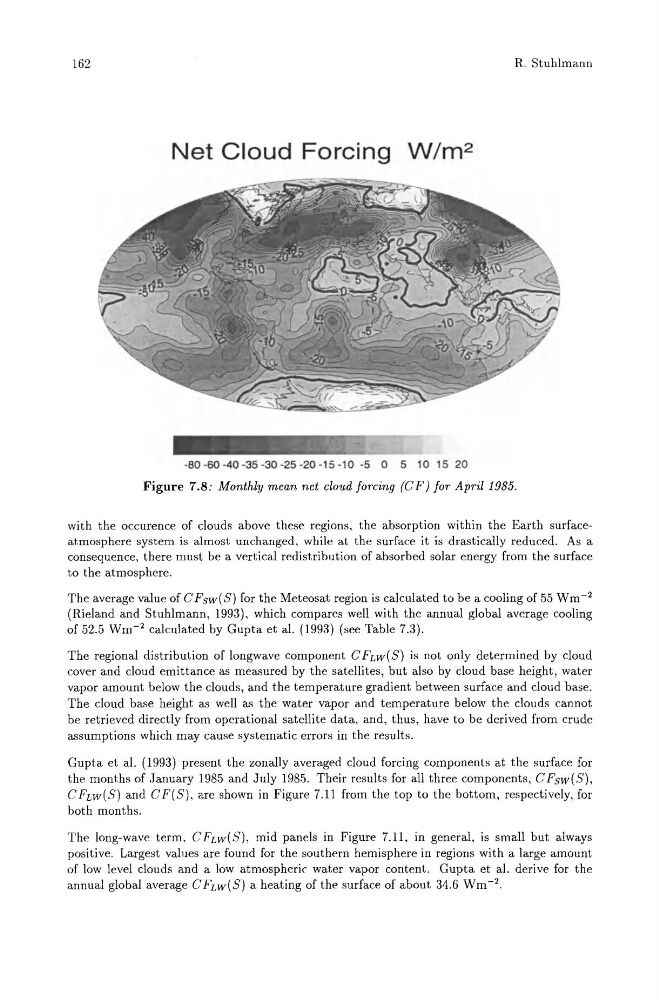
Figure 7.8: Monthly mean net cloud forcing (C F) for April 1985.
with the occurence of clouds above these regions, the absorption within the Earth surfaceatmosphere system is almost unchanged, while at the surface it is drastically reduced. As a
consequence, there must be a vertical redistribution of absorbed solar energy from the surface
to the atmosphere.
The average value of C Fsw(5) for the Meteosat region is calculated to be a cooling of 55 Wm- 2
(Rieland and Stuhlmann, 1993), which compares well with the annual global average cooling
of 52.5 Wm- 2 calculated by Gupta et al. (1993) (see Table 7.3).
The regional distribution of longwave component C FLW ( 5) is not only determined by cloud
cover and cloud emittance as measured by the satellites, but also by cloud base height, water
vapor amount below the clouds, and the temperature gradient between surface and cloud base.
The cloud base height as well as the water vapor and temperature below the clouds cannot
be retrieved directly from operational satellite data, and, thus, have to be derived from crude
assumptions which may cause systematic errors in the results.
Gupta et al. (1993) present the zonally averaged cloud forcing components at the surface for
the months of January 1985 and July 1985. Their results for all three components, CFsw(S),
CFLW(S) and CF(S), are shown in Figure 7.11 from the top to the bottom, respectively, for
both months.
The long-wave term, CFLW(S), mid panels in Figure 7.11, in general, is small but always
positive. Largest values are found for the southern hemisphere in regions with a large amount
of low level clouds and a low atmospheric water vapor content. Gupta et al. derive for the
annual global average C FLw(S) a heating of the surface of about 34.6 Wm- 2
R. Stuhlmann
Net Cloud Forcing W/m2
-80 -60 -40 -35 -30 -25 -20 -15 -10 -5 0 5 10 15 20
Figure 7.8: Monthly mean net cloud forcing (C F) for April 1985.
with the occurence of clouds above these regions, the absorption within the Earth surfaceatmosphere system is almost unchanged, while at the surface it is drastically reduced. As a
consequence, there must be a vertical redistribution of absorbed solar energy from the surface
to the atmosphere.
The average value of C Fsw(5) for the Meteosat region is calculated to be a cooling of 55 Wm- 2
(Rieland and Stuhlmann, 1993), which compares well with the annual global average cooling
of 52.5 Wm- 2 calculated by Gupta et al. (1993) (see Table 7.3).
The regional distribution of longwave component C FLW ( 5) is not only determined by cloud
cover and cloud emittance as measured by the satellites, but also by cloud base height, water
vapor amount below the clouds, and the temperature gradient between surface and cloud base.
The cloud base height as well as the water vapor and temperature below the clouds cannot
be retrieved directly from operational satellite data, and, thus, have to be derived from crude
assumptions which may cause systematic errors in the results.
Gupta et al. (1993) present the zonally averaged cloud forcing components at the surface for
the months of January 1985 and July 1985. Their results for all three components, CFsw(S),
CFLW(S) and CF(S), are shown in Figure 7.11 from the top to the bottom, respectively, for
both months.
The long-wave term, CFLW(S), mid panels in Figure 7.11, in general, is small but always
positive. Largest values are found for the southern hemisphere in regions with a large amount
of low level clouds and a low atmospheric water vapor content. Gupta et al. derive for the
annual global average C FLw(S) a heating of the surface of about 34.6 Wm- 2