

154
R. Stuhlmann
Outgoing Long-Wave Radiation W/m2
120
180
210
240
270
300
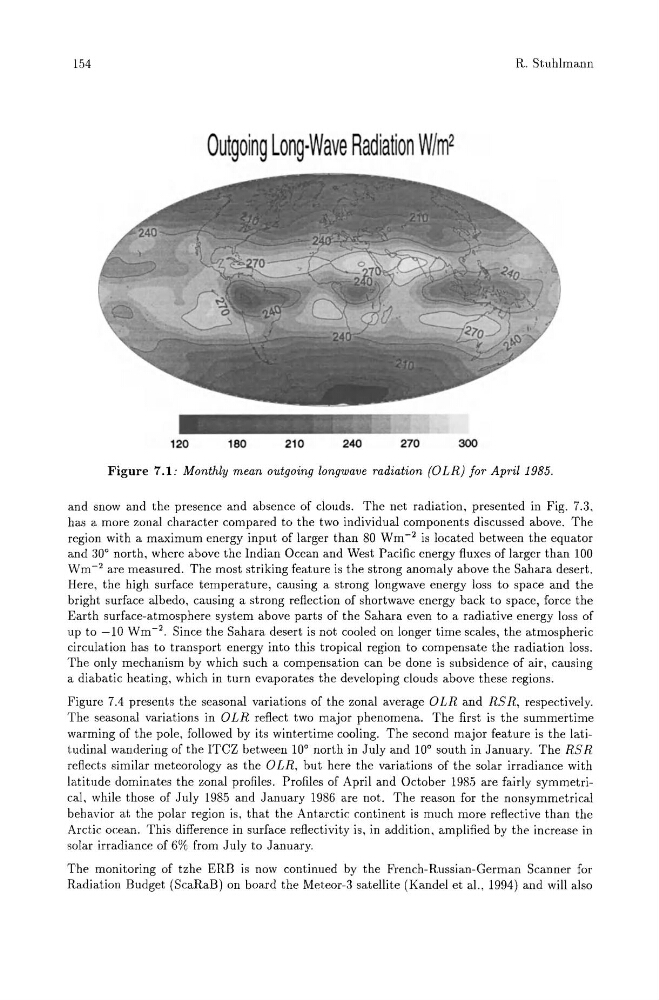
Figure 7.1: Monthly mean outgoing longwave radiation (OLR) for April 1985.
and snow and the presence and absence of clouds. The net radiation, presented in Fig. 7.3,
has a more zonal character compared to the two individual components discussed above. The
region with a maximum energy input of larger than 80 Wm- 2 is located between the equator
and 30° north, where above the Indian Ocean and West Pacific energy fluxes of larger than 100
Wm- 2 are measured. The most striking feature is the strong anomaly above the Sahara desert.
Here, the high surface temperature, causing a strong longwave energy loss to space and the
bright surface albedo, causing a strong reflection of shortwave energy back to space, force the
Earth surface-atmosphere system above parts of the Sahara even to a radiative energy loss of
up to -10 Wm- 2 . Since the Sahara desert is not cooled on longer time scales, the atmospheric
circulation has to transport energy into this tropical region to compensate the radiation loss.
The only mechanism by which such a compensation can be done is subsidence of air, causing
a diabatic heating, which in turn evaporates the developing clouds above these regions.
Figure 7.4 presents the seasonal variations of the zonal average OLR and RSR, respectively.
The seasonal variations in OLR reflect two major phenomena. The first is the summertime
warming of the pole, followed by its wintertime cooling. The second major feature is the latitudinal wandering of the ITCZ between 10° north in July and 10° south in January. The RSR
reflects similar meteorology as the OLR, but here the variations of the solar irradiance with
latitude dominates the zonal profiles. Profiles of April and October 1985 are fairly symmetrical, while those of July 1985 and January 1986 are not. The reason for the nonsymmetrical
behavior at the polar region is, that the Antarctic continent is much more reflective than the
Arctic ocean. This difference in surface reflectivity is , in addition, amplified by the increase in
solar irradiance of 6% from July to January.
The monitoring of tzhe ERB is now continued by the French-Russian-German Scanner for
Radiation Budget (ScaRaB) on board the Meteor-3 satellite (Kandel et aI., 1994) and will also
R. Stuhlmann
Outgoing Long-Wave Radiation W/m2
120
180
210
240
270
300
Figure 7.1: Monthly mean outgoing longwave radiation (OLR) for April 1985.
and snow and the presence and absence of clouds. The net radiation, presented in Fig. 7.3,
has a more zonal character compared to the two individual components discussed above. The
region with a maximum energy input of larger than 80 Wm- 2 is located between the equator
and 30° north, where above the Indian Ocean and West Pacific energy fluxes of larger than 100
Wm- 2 are measured. The most striking feature is the strong anomaly above the Sahara desert.
Here, the high surface temperature, causing a strong longwave energy loss to space and the
bright surface albedo, causing a strong reflection of shortwave energy back to space, force the
Earth surface-atmosphere system above parts of the Sahara even to a radiative energy loss of
up to -10 Wm- 2 . Since the Sahara desert is not cooled on longer time scales, the atmospheric
circulation has to transport energy into this tropical region to compensate the radiation loss.
The only mechanism by which such a compensation can be done is subsidence of air, causing
a diabatic heating, which in turn evaporates the developing clouds above these regions.
Figure 7.4 presents the seasonal variations of the zonal average OLR and RSR, respectively.
The seasonal variations in OLR reflect two major phenomena. The first is the summertime
warming of the pole, followed by its wintertime cooling. The second major feature is the latitudinal wandering of the ITCZ between 10° north in July and 10° south in January. The RSR
reflects similar meteorology as the OLR, but here the variations of the solar irradiance with
latitude dominates the zonal profiles. Profiles of April and October 1985 are fairly symmetrical, while those of July 1985 and January 1986 are not. The reason for the nonsymmetrical
behavior at the polar region is, that the Antarctic continent is much more reflective than the
Arctic ocean. This difference in surface reflectivity is , in addition, amplified by the increase in
solar irradiance of 6% from July to January.
The monitoring of tzhe ERB is now continued by the French-Russian-German Scanner for
Radiation Budget (ScaRaB) on board the Meteor-3 satellite (Kandel et aI., 1994) and will also