

Clouds and the Radiative Heating ...
153
surface-atmosphere system dependent on its temperature and moisture profiles and cloud top
height distributions.
QRAD = SoMo(l- a) - OLR = SoMa - RSR - OLR
(7.1 )
Equation 7.1 describes the Earth Radiation Budget at the top of the atmosphere, where, QRAD,
is the absorbed net-radiation eithin the system, SoMa, the incoming solar radiation, a, the
planetary albedo and, RS R and a LR, the reflected shortwave and outgoing longwave radiation
to space, respectively. Provided that there is no climatic change in temperature of the Earth
surface-atmosphere system, the annual and global average of the absorbed net-radiation, Q RAD,
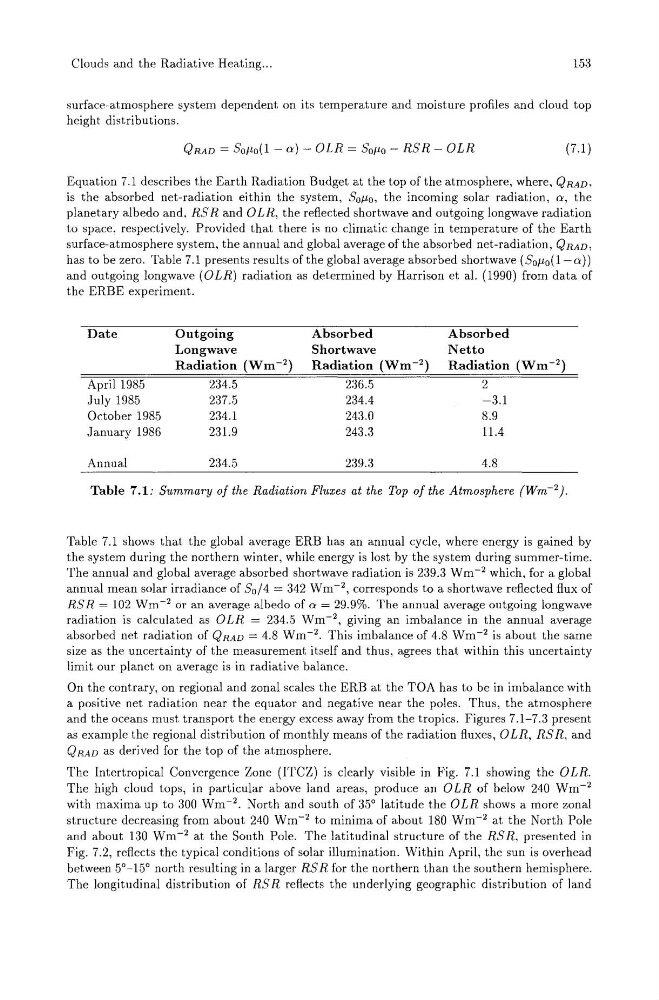
has to be zero. Table 7.1 presents results of the global average absorbed shortwave (SoMo(l-a)
and outgoing longwave (0 LR) radiation as determined by Harrison et al. (1990) from data of
the ERBE experiment.
Date
Outgoing
Absorbed
Absorbed
Longwave
Shortwave
Netto
Radiation (Wm-2) Radiation (Wm-2) Radiation (Wm-2)
April 1985
234.5
236.5
2
July 1985
237.5
234.4
-3.1
October 1985
234.1
243.0
8.9
January 1986
231.9
243.3
11.4
Annual
234.5
239.3
4.8
Table 7.1: Summary of the Radiation Fluxes at the Top of the Atmosphere (Wm- 2 ).
Table 7.1 shows that the global average ERB has an annual cycle, where energy is gained by
the system during the northern winter, while energy is lost by the system during summer-time.
The annual and global average absorbed shortwave radiation is 239.3 Wm- 2 which, for a global
annual mean solar irradiance of So/4 = 342 Wm- 2 , corresponds to a shortwave reflected flux of
RSR = 102 Wm- 2 or an average albedo of a = 29.9%. The annual average outgoing longwave
radiation is calculated as OLR = 234.5 Wm- 2 , giving an imbalance in the annual average
absorbed net radiation of QRAD = 4.8 Wm- 2 . This imbalance of 4.8 Wm- 2 is about the same
size as the uncertainty of the measurement itself and thus, agrees that within this uncertainty
limit our planet on average is in radiative balance.
On the contrary, on regional and zonal scales the ERB at the TOA has to be in imbalance with
a positive net radiation near the equator and negative near the poles. Thus, the atmosphere
and the oceans must transport the energy excess away from the tropics. Figures 7.1-7.3 present
as example the regional distribution of monthly means of the radiation fluxes, a LR, RS R, and
QRAD as derived for the top of the atmosphere.
The Intertropical Convergence Zone (ITCZ) is clearly visible in Fig. 7.1 showing the OLR.
The high cloud tops, in particular above land areas, produce an OLR of below 240 Wm- 2
with maxima up to 300 Wm- 2 . North and south of 35° latitude the OLR shows a more zonal
structure decreasing from about 240 Wm- 2 to minima of about 180 Wm- 2 at the North Pole
and about 130 Wm- 2 at the South Pole. The latitudinal structure of the RSR, presented in
Fig. 7.2, reflects the typical conditions of solar illumination. Within April, the sun is overhead
between 5°-15° north resulting in a larger RSR for the northern than the southern hemisphere.
The longitudinal distribution of RSR reflects the underlying geographic distribution of land
153
surface-atmosphere system dependent on its temperature and moisture profiles and cloud top
height distributions.
QRAD = SoMo(l- a) - OLR = SoMa - RSR - OLR
(7.1 )
Equation 7.1 describes the Earth Radiation Budget at the top of the atmosphere, where, QRAD,
is the absorbed net-radiation eithin the system, SoMa, the incoming solar radiation, a, the
planetary albedo and, RS R and a LR, the reflected shortwave and outgoing longwave radiation
to space, respectively. Provided that there is no climatic change in temperature of the Earth
surface-atmosphere system, the annual and global average of the absorbed net-radiation, Q RAD,
has to be zero. Table 7.1 presents results of the global average absorbed shortwave (SoMo(l-a)
and outgoing longwave (0 LR) radiation as determined by Harrison et al. (1990) from data of
the ERBE experiment.
Date
Outgoing
Absorbed
Absorbed
Longwave
Shortwave
Netto
Radiation (Wm-2) Radiation (Wm-2) Radiation (Wm-2)
April 1985
234.5
236.5
2
July 1985
237.5
234.4
-3.1
October 1985
234.1
243.0
8.9
January 1986
231.9
243.3
11.4
Annual
234.5
239.3
4.8
Table 7.1: Summary of the Radiation Fluxes at the Top of the Atmosphere (Wm- 2 ).
Table 7.1 shows that the global average ERB has an annual cycle, where energy is gained by
the system during the northern winter, while energy is lost by the system during summer-time.
The annual and global average absorbed shortwave radiation is 239.3 Wm- 2 which, for a global
annual mean solar irradiance of So/4 = 342 Wm- 2 , corresponds to a shortwave reflected flux of
RSR = 102 Wm- 2 or an average albedo of a = 29.9%. The annual average outgoing longwave
radiation is calculated as OLR = 234.5 Wm- 2 , giving an imbalance in the annual average
absorbed net radiation of QRAD = 4.8 Wm- 2 . This imbalance of 4.8 Wm- 2 is about the same
size as the uncertainty of the measurement itself and thus, agrees that within this uncertainty
limit our planet on average is in radiative balance.
On the contrary, on regional and zonal scales the ERB at the TOA has to be in imbalance with
a positive net radiation near the equator and negative near the poles. Thus, the atmosphere
and the oceans must transport the energy excess away from the tropics. Figures 7.1-7.3 present
as example the regional distribution of monthly means of the radiation fluxes, a LR, RS R, and
QRAD as derived for the top of the atmosphere.
The Intertropical Convergence Zone (ITCZ) is clearly visible in Fig. 7.1 showing the OLR.
The high cloud tops, in particular above land areas, produce an OLR of below 240 Wm- 2
with maxima up to 300 Wm- 2 . North and south of 35° latitude the OLR shows a more zonal
structure decreasing from about 240 Wm- 2 to minima of about 180 Wm- 2 at the North Pole
and about 130 Wm- 2 at the South Pole. The latitudinal structure of the RSR, presented in
Fig. 7.2, reflects the typical conditions of solar illumination. Within April, the sun is overhead
between 5°-15° north resulting in a larger RSR for the northern than the southern hemisphere.
The longitudinal distribution of RSR reflects the underlying geographic distribution of land