

Extratropical Cyclones: Their Mesoscale Structure, ...
143
2
0
a
6
4
'i'
C 2
N
e- o
::x: a
to)
(;l 6
::x:
4
2
0
8
6
4
2
0
-300
300
600
900
X (KM)
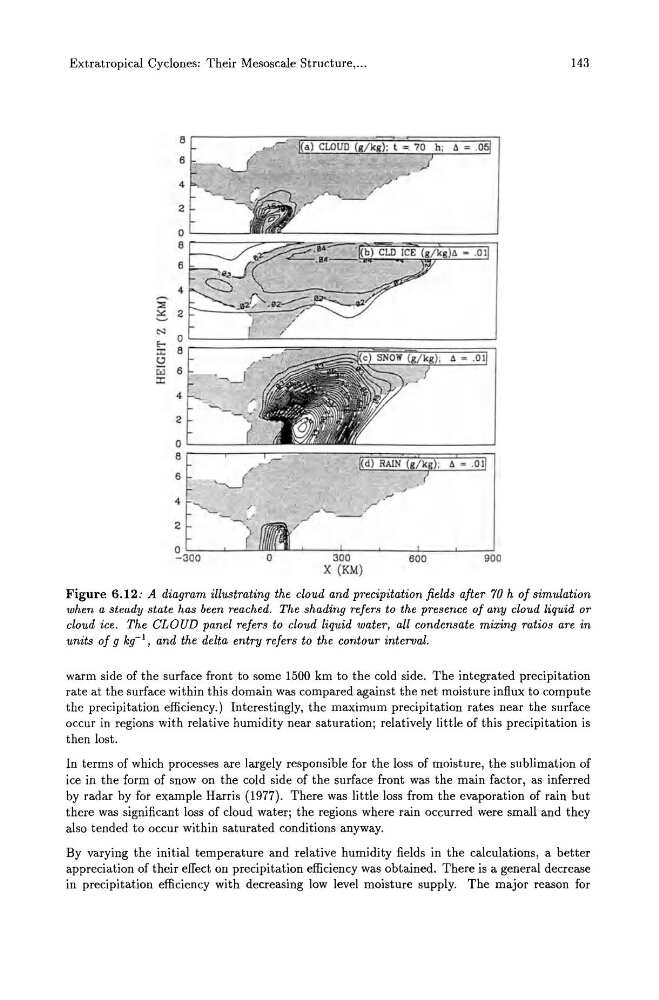
Figure 6.12: A diagram illustrating the cloud and precipitation fields after 70 h of simulation
when a steady state has been reached. The shading refers to the presence of any cloud liquid or
cloud ice. The CLOUD panel refers to cloud liquid water, all condensate mixing ratios are in
units of 9 kg-I, and the delta entry refers to the contour interval.
warm side of the surface front to some 1500 km to the cold side. The integrated precipitation
rate at the surface within this domain was compared against the net moisture influx to compute
the precipitation efficiency.) Interestingly, the maximum precipitation rates near the surface
occur in regions with relative humidity near saturation; relatively little of this precipitation is
then lost.
In terms of which processes are largely responsible for the loss of moisture, the sublimation of
ice in the form of snow on the cold side of the surface front was the main factor, as inferred
by radar by for example Harris (1977). There was little loss from the evaporation of rain but
there was significant loss of cloud water; the regions where rain occurred were small and they
also tended to occur within saturated conditions anyway.
By varying the initial temperature and relative humidity fields in the calculations, a better
appreciation of their effect on precipitation efficiency was obtained. There is a general decrease
in precipitation efficiency with decreasing low level moisture supply. The major reason for
143
2
0
a
6
4
'i'
C 2
N
e- o
::x: a
to)
(;l 6
::x:
4
2
0
8
6
4
2
0
-300
300
600
900
X (KM)
Figure 6.12: A diagram illustrating the cloud and precipitation fields after 70 h of simulation
when a steady state has been reached. The shading refers to the presence of any cloud liquid or
cloud ice. The CLOUD panel refers to cloud liquid water, all condensate mixing ratios are in
units of 9 kg-I, and the delta entry refers to the contour interval.
warm side of the surface front to some 1500 km to the cold side. The integrated precipitation
rate at the surface within this domain was compared against the net moisture influx to compute
the precipitation efficiency.) Interestingly, the maximum precipitation rates near the surface
occur in regions with relative humidity near saturation; relatively little of this precipitation is
then lost.
In terms of which processes are largely responsible for the loss of moisture, the sublimation of
ice in the form of snow on the cold side of the surface front was the main factor, as inferred
by radar by for example Harris (1977). There was little loss from the evaporation of rain but
there was significant loss of cloud water; the regions where rain occurred were small and they
also tended to occur within saturated conditions anyway.
By varying the initial temperature and relative humidity fields in the calculations, a better
appreciation of their effect on precipitation efficiency was obtained. There is a general decrease
in precipitation efficiency with decreasing low level moisture supply. The major reason for