

142
moist
. air
Ronald E. Stewart
Tropopause ~
.
) lofted ice
--~I-R/
January 21
cloud top
January 23
North Atlantic
Winter Storm
fallen ice
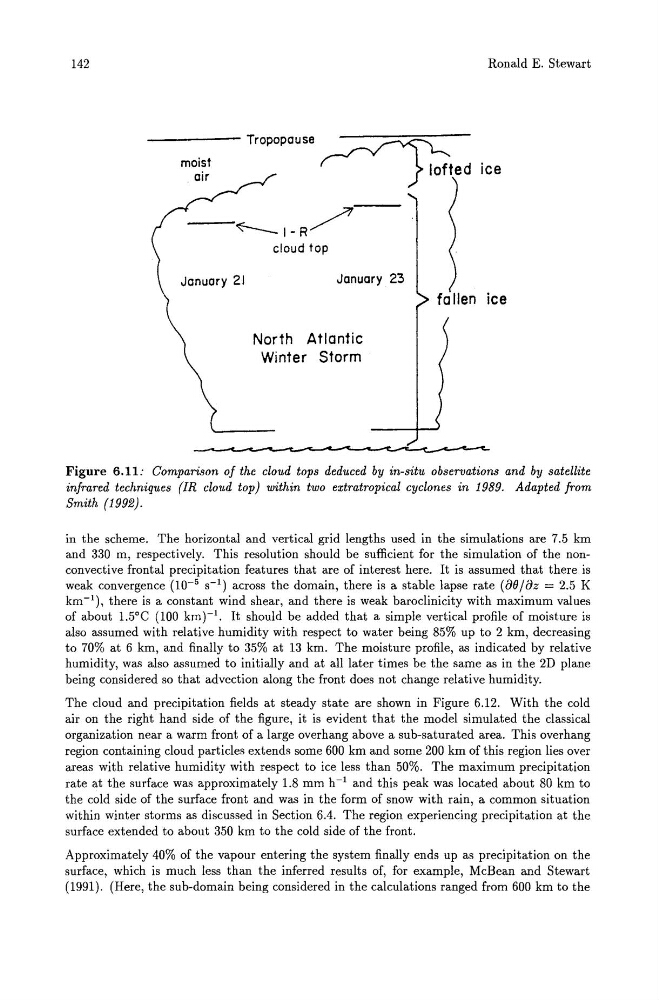
Figure 6.11: Comparison of the cloud tops deduced by in-situ observations and by satellite
infrared techniques (IR cloud top) within two extratropical cyclones in 1989. Adapted from
Smith (1992).
in the scheme. The horizontal and vertical grid lengths used in the simulations are 7.5 km
and 330 m, respectively. This resolution should be sufficient for the simulation of the nonconvective frontal precipitation features that are of interest here. It is assumed that there is
weak convergence (10- 5 s-l) across the domain, there is a stable lapse rate (Be / Bz = 2.5 K
km- 1 ), there is a constant wind shear, and there is weak baroclinicity with maximum values
of about l.soC (100 kmJ-1. It should be added that a simple vertical profile of moisture is
also assumed with relative humidity with respect to water being 85% up to 2 km, decreasing
to 70% at 6 km, and finally to 35% at 13 km. The moisture profile, as indicated by relative
humidity, was also assumed to initially and at all later times be the same as in the 2D plane
being considered so that advection along the front does not change relative humidity.
The cloud and precipitation fields at steady state are shown in Figure 6.12. With the cold
air on the right hand side of the figure, it is evident that the model simulated the classical
organization near a warm front of a large overhang above a sub-saturated area. This overhang
region containing cloud particles extends some 600 km and some 200 km of this region lies over
areas with relative humidity with respect to ice less than 50%. The maximum precipitation
rate at the surface was approximately 1.8 mm h- 1 and this peak was located about 80 km to
the cold side of the surface front and was in the form of snow with rain, a common situation
within winter storms as discussed in Section 6.4. The region experiencing precipitation at the
surface extended to about 350 km to the cold side of the front.
Approximately 40% of the vapour entering the system finally ends up as precipitation on the
surface, which is much less than the inferred results of, for example, McBean and Stewart
(1991). (Here, the sub-domain being considered in the calculations ranged from 600 km to the
moist
. air
Ronald E. Stewart
Tropopause ~
.
) lofted ice
--~I-R/
January 21
cloud top
January 23
North Atlantic
Winter Storm
fallen ice
Figure 6.11: Comparison of the cloud tops deduced by in-situ observations and by satellite
infrared techniques (IR cloud top) within two extratropical cyclones in 1989. Adapted from
Smith (1992).
in the scheme. The horizontal and vertical grid lengths used in the simulations are 7.5 km
and 330 m, respectively. This resolution should be sufficient for the simulation of the nonconvective frontal precipitation features that are of interest here. It is assumed that there is
weak convergence (10- 5 s-l) across the domain, there is a stable lapse rate (Be / Bz = 2.5 K
km- 1 ), there is a constant wind shear, and there is weak baroclinicity with maximum values
of about l.soC (100 kmJ-1. It should be added that a simple vertical profile of moisture is
also assumed with relative humidity with respect to water being 85% up to 2 km, decreasing
to 70% at 6 km, and finally to 35% at 13 km. The moisture profile, as indicated by relative
humidity, was also assumed to initially and at all later times be the same as in the 2D plane
being considered so that advection along the front does not change relative humidity.
The cloud and precipitation fields at steady state are shown in Figure 6.12. With the cold
air on the right hand side of the figure, it is evident that the model simulated the classical
organization near a warm front of a large overhang above a sub-saturated area. This overhang
region containing cloud particles extends some 600 km and some 200 km of this region lies over
areas with relative humidity with respect to ice less than 50%. The maximum precipitation
rate at the surface was approximately 1.8 mm h- 1 and this peak was located about 80 km to
the cold side of the surface front and was in the form of snow with rain, a common situation
within winter storms as discussed in Section 6.4. The region experiencing precipitation at the
surface extended to about 350 km to the cold side of the front.
Approximately 40% of the vapour entering the system finally ends up as precipitation on the
surface, which is much less than the inferred results of, for example, McBean and Stewart
(1991). (Here, the sub-domain being considered in the calculations ranged from 600 km to the