

reported the same decreasing trend of mean wheat yield due to change in precipitation pattern. Our results support the findings of (Ashfaq et al. 2011) that
extensive variation in rainfall is seen for past 3 years in Pakistan and it caused high
risk to wheat crop.
Interaction terms of both normal temperature and precipitation are
non-significant with decreasing (negative) risk coefficients during all the three
stages of wheat crop. It means that both long-term temperature and precipitation
have conjointly diminishing risk effect for wheat crop during whole growing season. In above risk analysis, Sialkot is considered as base district not included in
regression analysis to avoid dummy variable trap. However, coefficients of other
district dummies were negative and non-significant showing that wheat in Sialkot
region was much vulnerable compared to other zones. This is due to high variation
in precipitation patterns especially during harvesting stage. Mardan district was
vulnerable at top second level having highest variation in climatic parameters but
has least area under cultivation. Overall, Zone-A had small share in area under
wheat crop cultivation, and Banazir Abad and Sukkur were the least vulnerable
districts to climatic variations as our findings suggest.
3.3 Per-Capita Availability
As wheat crop serves as staple food and largest grain source in the country, hence, it
is one of the most essential crops for national food security (Ahmad et al. 2014).
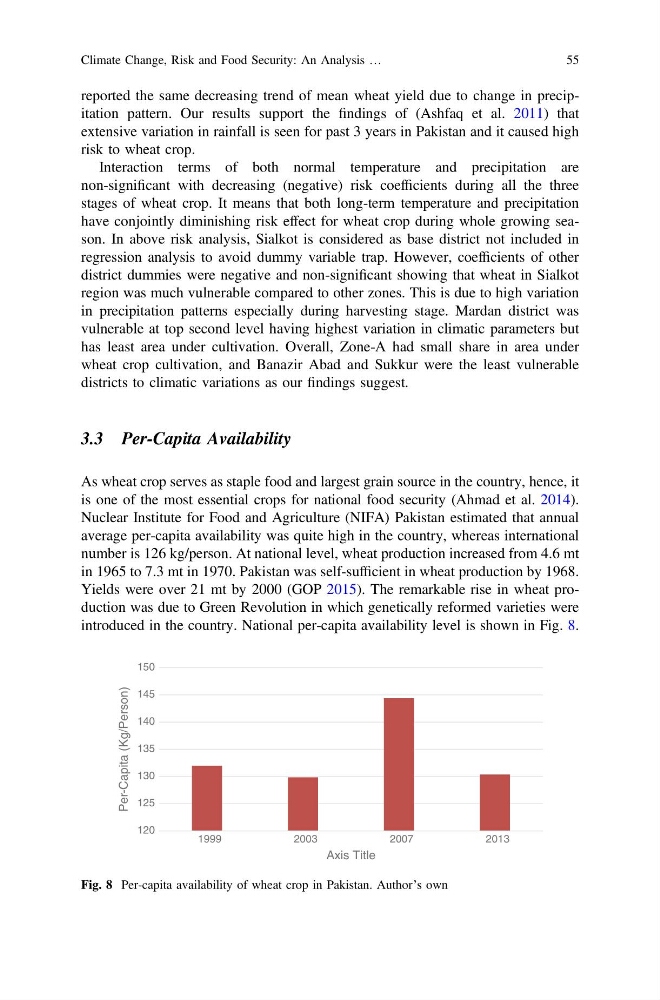
Nuclear Institute for Food and Agriculture (NIFA) Pakistan estimated that annual
average per-capita availability was quite high in the country, whereas international
number is 126 kg/person. At national level, wheat production increased from 4.6 mt
in 1965 to 7.3 mt in 1970. Pakistan was self-sufficient in wheat production by 1968.
Yields were over 21 mt by 2000 (GOP 2015). The remarkable rise in wheat production was due to Green Revolution in which genetically reformed varieties were
introduced in the country. National per-capita availability level is shown in Fig. 8.
120
125
130
135
140
145
150
1999
2003
2007
2013
Per-Capita (Kg/Person)
Axis Title
Fig. 8 Per-capita availability of wheat crop in Pakistan. Author’s own
Climate Change, Risk and Food Security: An Analysis …
55
extensive variation in rainfall is seen for past 3 years in Pakistan and it caused high
risk to wheat crop.
Interaction terms of both normal temperature and precipitation are
non-significant with decreasing (negative) risk coefficients during all the three
stages of wheat crop. It means that both long-term temperature and precipitation
have conjointly diminishing risk effect for wheat crop during whole growing season. In above risk analysis, Sialkot is considered as base district not included in
regression analysis to avoid dummy variable trap. However, coefficients of other
district dummies were negative and non-significant showing that wheat in Sialkot
region was much vulnerable compared to other zones. This is due to high variation
in precipitation patterns especially during harvesting stage. Mardan district was
vulnerable at top second level having highest variation in climatic parameters but
has least area under cultivation. Overall, Zone-A had small share in area under
wheat crop cultivation, and Banazir Abad and Sukkur were the least vulnerable
districts to climatic variations as our findings suggest.
3.3 Per-Capita Availability
As wheat crop serves as staple food and largest grain source in the country, hence, it
is one of the most essential crops for national food security (Ahmad et al. 2014).
Nuclear Institute for Food and Agriculture (NIFA) Pakistan estimated that annual
average per-capita availability was quite high in the country, whereas international
number is 126 kg/person. At national level, wheat production increased from 4.6 mt
in 1965 to 7.3 mt in 1970. Pakistan was self-sufficient in wheat production by 1968.
Yields were over 21 mt by 2000 (GOP 2015). The remarkable rise in wheat production was due to Green Revolution in which genetically reformed varieties were
introduced in the country. National per-capita availability level is shown in Fig. 8.
120
125
130
135
140
145
150
1999
2003
2007
2013
Per-Capita (Kg/Person)
Axis Title
Fig. 8 Per-capita availability of wheat crop in Pakistan. Author’s own
Climate Change, Risk and Food Security: An Analysis …
55