

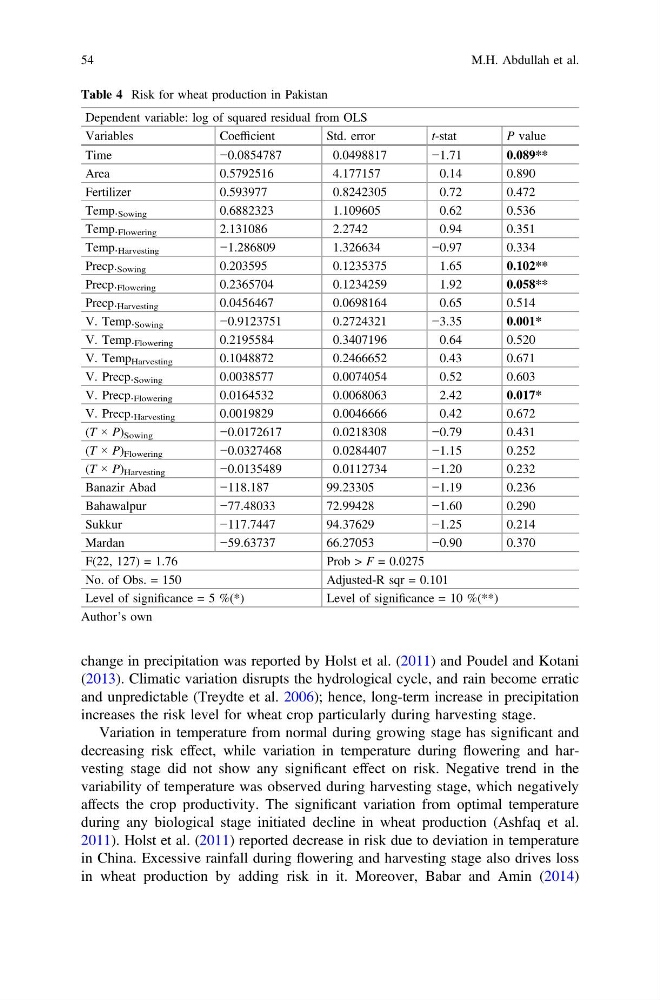
change in precipitation was reported by Holst et al. (2011) and Poudel and Kotani
(2013). Climatic variation disrupts the hydrological cycle, and rain become erratic
and unpredictable (Treydte et al. 2006); hence, long-term increase in precipitation
increases the risk level for wheat crop particularly during harvesting stage.
Variation in temperature from normal during growing stage has significant and
decreasing risk effect, while variation in temperature during flowering and harvesting stage did not show any significant effect on risk. Negative trend in the
variability of temperature was observed during harvesting stage, which negatively
affects the crop productivity. The significant variation from optimal temperature
during any biological stage initiated decline in wheat production (Ashfaq et al.
2011). Holst et al. (2011) reported decrease in risk due to deviation in temperature
in China. Excessive rainfall during flowering and harvesting stage also drives loss
in wheat production by adding risk in it. Moreover, Babar and Amin (2014)
Table 4 Risk for wheat production in Pakistan
Dependent variable: log of squared residual from OLS
Variables
Coefficient
Std. error
t-stat
P value
Time
−0.0854787
0.0498817
−1.71
0.089**
Area
0.5792516
4.177157
0.14
0.890
Fertilizer
0.593977
0.8242305
0.72
0.472
Temp. Sowing
0.6882323
1.109605
0.62
0.536
Temp. Flowering
2.131086
2.2742
0.94
0.351
Temp. Harvesting
−1.286809
1.326634
−0.97
0.334
Precp. Sowing
0.203595
0.1235375
1.65
0.102**
Precp. Flowering
0.2365704
0.1234259
1.92
0.058**
Precp. Harvesting
0.0456467
0.0698164
0.65
0.514
V. Temp. Sowing
−0.9123751
0.2724321
−3.35
0.001*
V. Temp. Flowering
0.2195584
0.3407196
0.64
0.520
V. Temp Harvesting
0.1048872
0.2466652
0.43
0.671
V. Precp. Sowing
0.0038577
0.0074054
0.52
0.603
V. Precp. Flowering
0.0164532
0.0068063
2.42
0.017*
V. Precp. Harvesting
0.0019829
0.0046666
0.42
0.672
(T × P) Sowing
−0.0172617
0.0218308
−0.79
0.431
(T × P) Flowering
−0.0327468
0.0284407
−1.15
0.252
(T × P) Harvesting
−0.0135489
0.0112734
−1.20
0.232
Banazir Abad
−118.187
99.23305
−1.19
0.236
Bahawalpur
−77.48033
72.99428
−1.60
0.290
Sukkur
−117.7447
94.37629
−1.25
0.214
Mardan
−59.63737
66.27053
−0.90
0.370
F(22, 127) = 1.76
Prob > F = 0.0275
No. of Obs. = 150
Adjusted-R sqr = 0.101
Level of significance = 5 %(*)
Level of significance = 10 %(**)
Author’s own
54
M.H. Abdullah et al.
(2013). Climatic variation disrupts the hydrological cycle, and rain become erratic
and unpredictable (Treydte et al. 2006); hence, long-term increase in precipitation
increases the risk level for wheat crop particularly during harvesting stage.
Variation in temperature from normal during growing stage has significant and
decreasing risk effect, while variation in temperature during flowering and harvesting stage did not show any significant effect on risk. Negative trend in the
variability of temperature was observed during harvesting stage, which negatively
affects the crop productivity. The significant variation from optimal temperature
during any biological stage initiated decline in wheat production (Ashfaq et al.
2011). Holst et al. (2011) reported decrease in risk due to deviation in temperature
in China. Excessive rainfall during flowering and harvesting stage also drives loss
in wheat production by adding risk in it. Moreover, Babar and Amin (2014)
Table 4 Risk for wheat production in Pakistan
Dependent variable: log of squared residual from OLS
Variables
Coefficient
Std. error
t-stat
P value
Time
−0.0854787
0.0498817
−1.71
0.089**
Area
0.5792516
4.177157
0.14
0.890
Fertilizer
0.593977
0.8242305
0.72
0.472
Temp. Sowing
0.6882323
1.109605
0.62
0.536
Temp. Flowering
2.131086
2.2742
0.94
0.351
Temp. Harvesting
−1.286809
1.326634
−0.97
0.334
Precp. Sowing
0.203595
0.1235375
1.65
0.102**
Precp. Flowering
0.2365704
0.1234259
1.92
0.058**
Precp. Harvesting
0.0456467
0.0698164
0.65
0.514
V. Temp. Sowing
−0.9123751
0.2724321
−3.35
0.001*
V. Temp. Flowering
0.2195584
0.3407196
0.64
0.520
V. Temp Harvesting
0.1048872
0.2466652
0.43
0.671
V. Precp. Sowing
0.0038577
0.0074054
0.52
0.603
V. Precp. Flowering
0.0164532
0.0068063
2.42
0.017*
V. Precp. Harvesting
0.0019829
0.0046666
0.42
0.672
(T × P) Sowing
−0.0172617
0.0218308
−0.79
0.431
(T × P) Flowering
−0.0327468
0.0284407
−1.15
0.252
(T × P) Harvesting
−0.0135489
0.0112734
−1.20
0.232
Banazir Abad
−118.187
99.23305
−1.19
0.236
Bahawalpur
−77.48033
72.99428
−1.60
0.290
Sukkur
−117.7447
94.37629
−1.25
0.214
Mardan
−59.63737
66.27053
−0.90
0.370
F(22, 127) = 1.76
Prob > F = 0.0275
No. of Obs. = 150
Adjusted-R sqr = 0.101
Level of significance = 5 %(*)
Level of significance = 10 %(**)
Author’s own
54
M.H. Abdullah et al.