

4.3 Decision on Land Use to Secure the Livelihood
In the region, the rainfed agriculture on steep terraces is the predominant form of
land use and a majority of the population is involved in agriculture. At present, the
average per capita land holding ranges from 0.15 to 0.21 ha. The average of decadal
growth rate for the study region for the last two to three decades is 15.74 % (Census
of India 2001). Therefore, the per capita land holding decreased from 0.023 to
0.033 ha at decadal intervals. The land use change trend was analyzed from 1970 to
the present. It is very difficult to analyze the land use change pattern before 1970
due to some flaw in the methodology, missing historical ground data at our level
and, more particularly, only using the conventional methods. Therefore, we have
taken the land use under each crop during 1970 to evaluate and to understand the
land use change trends in the region. Based on the study, we found that the traditional land use system is changing very fast in this region. The magnitude of land
use change in the region comes from two types: (a) where traditional land use is
totally changed and farmers have introduced modern crops, such as tomato and bell
pepper cultivation, to fetch more economic benefit; (b) where traditional land
race-based cultivation is being replaced by the high yielding varieties of paddy and
wheat and other cash crops (Nautiyal et al. 2007). From the period of 1970–80 and
1980–90, the land use under many traditional crops was reduced between 15 and
60 %. However, this trend continued, and in the year 2000, the decline in land use
under traditional crops increased between 50 and 96 % (Nautiyal and Kaechele
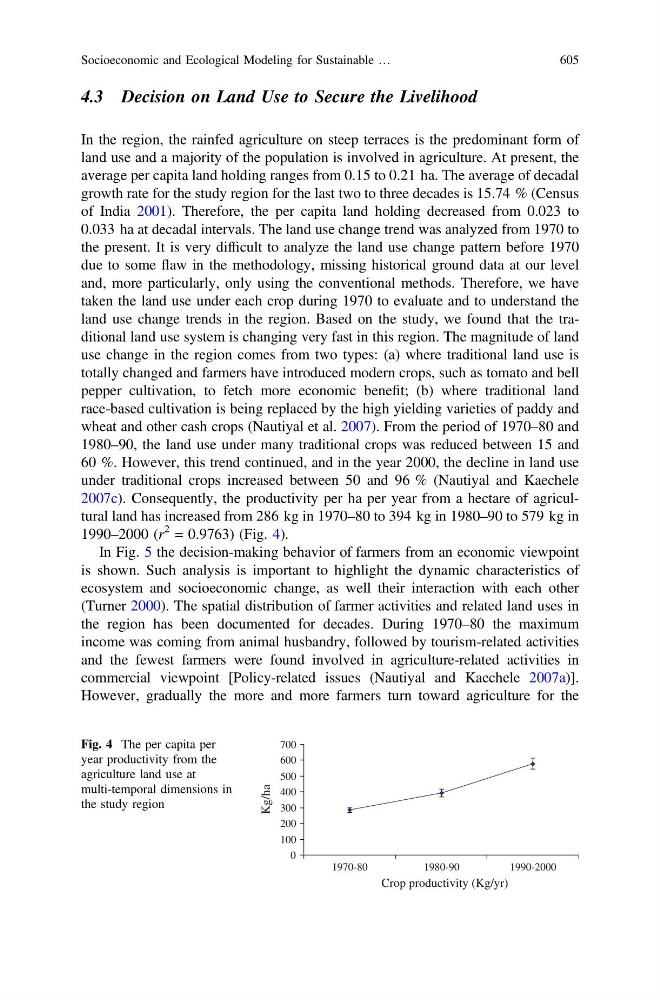
2007c). Consequently, the productivity per ha per year from a hectare of agricultural land has increased from 286 kg in 1970–80 to 394 kg in 1980–90 to 579 kg in
1990–2000 (r
2 = 0.9763) (Fig. 4).
In Fig. 5 the decision-making behavior of farmers from an economic viewpoint
is shown. Such analysis is important to highlight the dynamic characteristics of
ecosystem and socioeconomic change, as well their interaction with each other
(Turner 2000). The spatial distribution of farmer activities and related land uses in
the region has been documented for decades. During 1970–80 the maximum
income was coming from animal husbandry, followed by tourism-related activities
and the fewest farmers were found involved in agriculture-related activities in
commercial viewpoint [Policy-related issues (Nautiyal and Kaechele 2007a)].
However, gradually the more and more farmers turn toward agriculture for the
0
100
200
300
400
500
600
700
1970-80
1980-90
1990-2000
Crop productivity (Kg/yr)
Kg/ha
Fig. 4 The per capita per
year productivity from the
agriculture land use at
multi-temporal dimensions in
the study region
Socioeconomic and Ecological Modeling for Sustainable …
605