

Indicator 13: Cropping Pattern and Agricultural Productivity
Agricultural productivity is assumed to be directly proportional to the area under
various crops. As per data collected from the district handbook, there has been a
decrease in land under agricultural crops over the last two decades as shown in
Table 11.
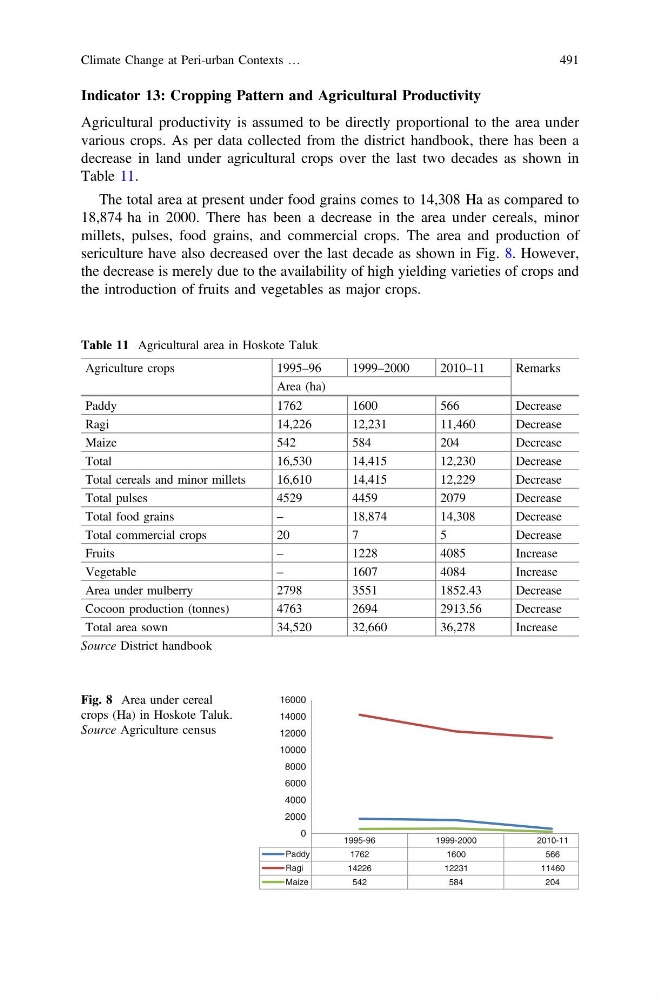
The total area at present under food grains comes to 14,308 Ha as compared to
18,874 ha in 2000. There has been a decrease in the area under cereals, minor
millets, pulses, food grains, and commercial crops. The area and production of
sericulture have also decreased over the last decade as shown in Fig. 8. However,
the decrease is merely due to the availability of high yielding varieties of crops and
the introduction of fruits and vegetables as major crops.
Table 11 Agricultural area in Hoskote Taluk
Agriculture crops
1995–96
1999–2000
2010–11
Remarks
Area (ha)
Paddy
1762
1600
566
Decrease
Ragi
14,226
12,231
11,460
Decrease
Maize
542
584
204
Decrease
Total
16,530
14,415
12,230
Decrease
Total cereals and minor millets
16,610
14,415
12,229
Decrease
Total pulses
4529
4459
2079
Decrease
Total food grains
–
18,874
14,308
Decrease
Total commercial crops
20
7
5
Decrease
Fruits
–
1228
4085
Increase
Vegetable
–
1607
4084
Increase
Area under mulberry
2798
3551
1852.43
Decrease
Cocoon production (tonnes)
4763
2694
2913.56
Decrease
Total area sown
34,520
32,660
36,278
Increase
Source District handbook
1995-96
1999-2000
2010-11
Paddy
1762
1600
566
Ragi
14226
12231
11460
Maize
542
584
204
0
2000
4000
6000
8000
10000
12000
14000
16000
Fig. 8 Area under cereal
crops (Ha) in Hoskote Taluk.
Source Agriculture census
Climate Change at Peri-urban Contexts …
491
Agricultural productivity is assumed to be directly proportional to the area under
various crops. As per data collected from the district handbook, there has been a
decrease in land under agricultural crops over the last two decades as shown in
Table 11.
The total area at present under food grains comes to 14,308 Ha as compared to
18,874 ha in 2000. There has been a decrease in the area under cereals, minor
millets, pulses, food grains, and commercial crops. The area and production of
sericulture have also decreased over the last decade as shown in Fig. 8. However,
the decrease is merely due to the availability of high yielding varieties of crops and
the introduction of fruits and vegetables as major crops.
Table 11 Agricultural area in Hoskote Taluk
Agriculture crops
1995–96
1999–2000
2010–11
Remarks
Area (ha)
Paddy
1762
1600
566
Decrease
Ragi
14,226
12,231
11,460
Decrease
Maize
542
584
204
Decrease
Total
16,530
14,415
12,230
Decrease
Total cereals and minor millets
16,610
14,415
12,229
Decrease
Total pulses
4529
4459
2079
Decrease
Total food grains
–
18,874
14,308
Decrease
Total commercial crops
20
7
5
Decrease
Fruits
–
1228
4085
Increase
Vegetable
–
1607
4084
Increase
Area under mulberry
2798
3551
1852.43
Decrease
Cocoon production (tonnes)
4763
2694
2913.56
Decrease
Total area sown
34,520
32,660
36,278
Increase
Source District handbook
1995-96
1999-2000
2010-11
Paddy
1762
1600
566
Ragi
14226
12231
11460
Maize
542
584
204
0
2000
4000
6000
8000
10000
12000
14000
16000
Fig. 8 Area under cereal
crops (Ha) in Hoskote Taluk.
Source Agriculture census
Climate Change at Peri-urban Contexts …
491