

4.3 Land Use Land Cover Indicators
Land use and land cover data published by the Census of India in the years 1991
and 2001 have been used for assessment. The aim of the assessment is to find
evidence of a decreased agricultural activity and agricultural production in relation
to climate change factors.
Indicator 12: Agricultural Area
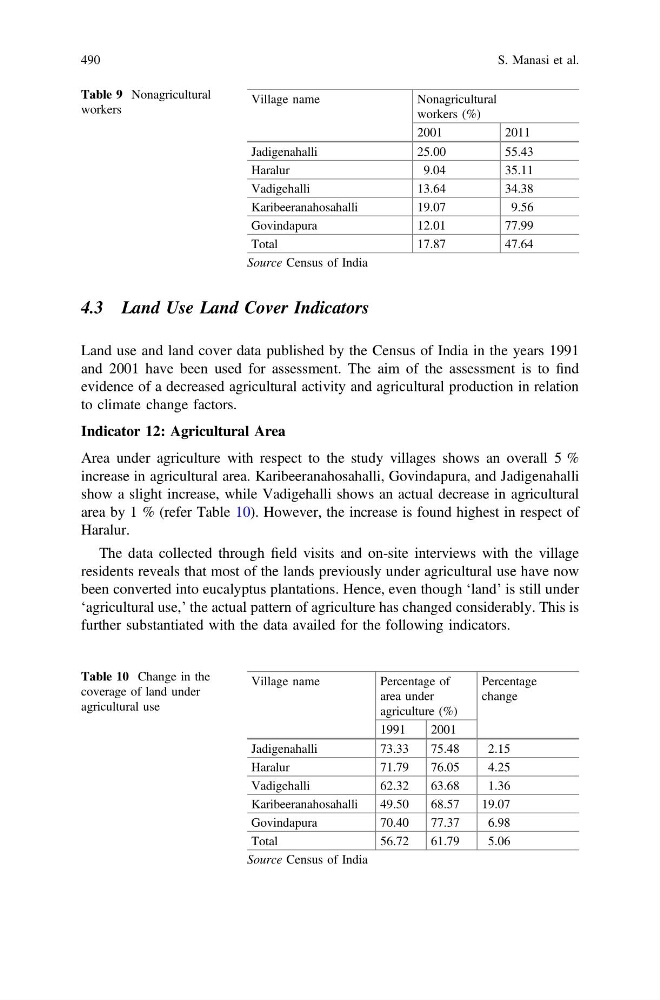
Area under agriculture with respect to the study villages shows an overall 5 %
increase in agricultural area. Karibeeranahosahalli, Govindapura, and Jadigenahalli
show a slight increase, while Vadigehalli shows an actual decrease in agricultural
area by 1 % (refer Table 10). However, the increase is found highest in respect of
Haralur.
The data collected through field visits and on-site interviews with the village
residents reveals that most of the lands previously under agricultural use have now
been converted into eucalyptus plantations. Hence, even though ‘land’ is still under
‘agricultural use,’ the actual pattern of agriculture has changed considerably. This is
further substantiated with the data availed for the following indicators.
Table 9 Nonagricultural
workers
Village name
Nonagricultural
workers (%)
2001
2011
Jadigenahalli
25.00
55.43
Haralur
9.04
35.11
Vadigehalli
13.64
34.38
Karibeeranahosahalli
19.07
9.56
Govindapura
12.01
77.99
Total
17.87
47.64
Source Census of India
Table 10 Change in the
coverage of land under
agricultural use
Village name
Percentage of
area under
agriculture (%)
Percentage
change
1991
2001
Jadigenahalli
73.33
75.48
2.15
Haralur
71.79
76.05
4.25
Vadigehalli
62.32
63.68
1.36
Karibeeranahosahalli
49.50
68.57
19.07
Govindapura
70.40
77.37
6.98
Total
56.72
61.79
5.06
Source Census of India
490
S. Manasi et al.
Land use and land cover data published by the Census of India in the years 1991
and 2001 have been used for assessment. The aim of the assessment is to find
evidence of a decreased agricultural activity and agricultural production in relation
to climate change factors.
Indicator 12: Agricultural Area
Area under agriculture with respect to the study villages shows an overall 5 %
increase in agricultural area. Karibeeranahosahalli, Govindapura, and Jadigenahalli
show a slight increase, while Vadigehalli shows an actual decrease in agricultural
area by 1 % (refer Table 10). However, the increase is found highest in respect of
Haralur.
The data collected through field visits and on-site interviews with the village
residents reveals that most of the lands previously under agricultural use have now
been converted into eucalyptus plantations. Hence, even though ‘land’ is still under
‘agricultural use,’ the actual pattern of agriculture has changed considerably. This is
further substantiated with the data availed for the following indicators.
Table 9 Nonagricultural
workers
Village name
Nonagricultural
workers (%)
2001
2011
Jadigenahalli
25.00
55.43
Haralur
9.04
35.11
Vadigehalli
13.64
34.38
Karibeeranahosahalli
19.07
9.56
Govindapura
12.01
77.99
Total
17.87
47.64
Source Census of India
Table 10 Change in the
coverage of land under
agricultural use
Village name
Percentage of
area under
agriculture (%)
Percentage
change
1991
2001
Jadigenahalli
73.33
75.48
2.15
Haralur
71.79
76.05
4.25
Vadigehalli
62.32
63.68
1.36
Karibeeranahosahalli
49.50
68.57
19.07
Govindapura
70.40
77.37
6.98
Total
56.72
61.79
5.06
Source Census of India
490
S. Manasi et al.