

Indicator 10: Agricultural Workers
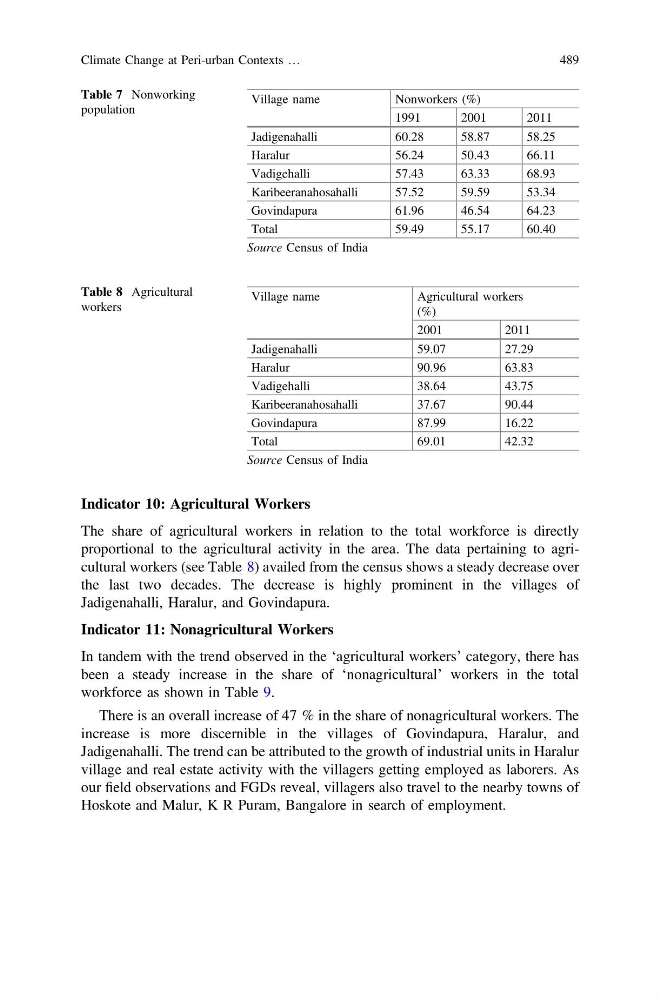
The share of agricultural workers in relation to the total workforce is directly
proportional to the agricultural activity in the area. The data pertaining to agricultural workers (see Table 8) availed from the census shows a steady decrease over
the last two decades. The decrease is highly prominent in the villages of
Jadigenahalli, Haralur, and Govindapura.
Indicator 11: Nonagricultural Workers
In tandem with the trend observed in the ‘agricultural workers’ category, there has
been a steady increase in the share of ‘nonagricultural’ workers in the total
workforce as shown in Table 9.
There is an overall increase of 47 % in the share of nonagricultural workers. The
increase is more discernible in the villages of Govindapura, Haralur, and
Jadigenahalli. The trend can be attributed to the growth of industrial units in Haralur
village and real estate activity with the villagers getting employed as laborers. As
our field observations and FGDs reveal, villagers also travel to the nearby towns of
Hoskote and Malur, K R Puram, Bangalore in search of employment.
Table 7 Nonworking
population
Village name
Nonworkers (%)
1991
2001
2011
Jadigenahalli
60.28
58.87
58.25
Haralur
56.24
50.43
66.11
Vadigehalli
57.43
63.33
68.93
Karibeeranahosahalli
57.52
59.59
53.34
Govindapura
61.96
46.54
64.23
Total
59.49
55.17
60.40
Source Census of India
Table 8 Agricultural
workers
Village name
Agricultural workers
(%)
2001
2011
Jadigenahalli
59.07
27.29
Haralur
90.96
63.83
Vadigehalli
38.64
43.75
Karibeeranahosahalli
37.67
90.44
Govindapura
87.99
16.22
Total
69.01
42.32
Source Census of India
Climate Change at Peri-urban Contexts …
489
The share of agricultural workers in relation to the total workforce is directly
proportional to the agricultural activity in the area. The data pertaining to agricultural workers (see Table 8) availed from the census shows a steady decrease over
the last two decades. The decrease is highly prominent in the villages of
Jadigenahalli, Haralur, and Govindapura.
Indicator 11: Nonagricultural Workers
In tandem with the trend observed in the ‘agricultural workers’ category, there has
been a steady increase in the share of ‘nonagricultural’ workers in the total
workforce as shown in Table 9.
There is an overall increase of 47 % in the share of nonagricultural workers. The
increase is more discernible in the villages of Govindapura, Haralur, and
Jadigenahalli. The trend can be attributed to the growth of industrial units in Haralur
village and real estate activity with the villagers getting employed as laborers. As
our field observations and FGDs reveal, villagers also travel to the nearby towns of
Hoskote and Malur, K R Puram, Bangalore in search of employment.
Table 7 Nonworking
population
Village name
Nonworkers (%)
1991
2001
2011
Jadigenahalli
60.28
58.87
58.25
Haralur
56.24
50.43
66.11
Vadigehalli
57.43
63.33
68.93
Karibeeranahosahalli
57.52
59.59
53.34
Govindapura
61.96
46.54
64.23
Total
59.49
55.17
60.40
Source Census of India
Table 8 Agricultural
workers
Village name
Agricultural workers
(%)
2001
2011
Jadigenahalli
59.07
27.29
Haralur
90.96
63.83
Vadigehalli
38.64
43.75
Karibeeranahosahalli
37.67
90.44
Govindapura
87.99
16.22
Total
69.01
42.32
Source Census of India
Climate Change at Peri-urban Contexts …
489