

Indicator 7: Literacy Rate
Literacy data related to the study area shows a steady increase in the literacy level.
However, overall, the literacy rate of 71 % is still lower than the national average of
73 % and the state average of 75 %.
(b) Economic indicators
Indicator 8: Work Participation
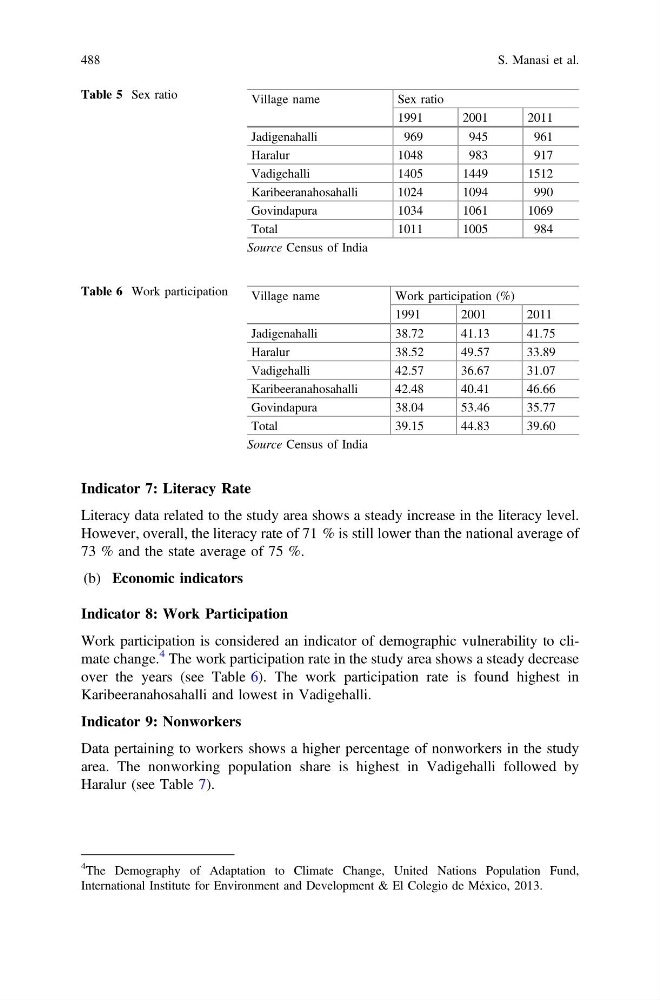
Work participation is considered an indicator of demographic vulnerability to climate change.
4 The work participation rate in the study area shows a steady decrease
over the years (see Table 6). The work participation rate is found highest in
Karibeeranahosahalli and lowest in Vadigehalli.
Indicator 9: Nonworkers
Data pertaining to workers shows a higher percentage of nonworkers in the study
area. The nonworking population share is highest in Vadigehalli followed by
Haralur (see Table 7).
Table 5 Sex ratio
Village name
Sex ratio
1991
2001
2011
Jadigenahalli
969
945
961
Haralur
1048
983
917
Vadigehalli
1405
1449
1512
Karibeeranahosahalli
1024
1094
990
Govindapura
1034
1061
1069
Total
1011
1005
984
Source Census of India
Table 6 Work participation
Village name
Work participation (%)
1991
2001
2011
Jadigenahalli
38.72
41.13
41.75
Haralur
38.52
49.57
33.89
Vadigehalli
42.57
36.67
31.07
Karibeeranahosahalli
42.48
40.41
46.66
Govindapura
38.04
53.46
35.77
Total
39.15
44.83
39.60
Source Census of India
4
The Demography of Adaptation to Climate Change, United Nations Population Fund,
International Institute for Environment and Development & El Colegio de México, 2013.
488
S. Manasi et al.
Literacy data related to the study area shows a steady increase in the literacy level.
However, overall, the literacy rate of 71 % is still lower than the national average of
73 % and the state average of 75 %.
(b) Economic indicators
Indicator 8: Work Participation
Work participation is considered an indicator of demographic vulnerability to climate change.
4 The work participation rate in the study area shows a steady decrease
over the years (see Table 6). The work participation rate is found highest in
Karibeeranahosahalli and lowest in Vadigehalli.
Indicator 9: Nonworkers
Data pertaining to workers shows a higher percentage of nonworkers in the study
area. The nonworking population share is highest in Vadigehalli followed by
Haralur (see Table 7).
Table 5 Sex ratio
Village name
Sex ratio
1991
2001
2011
Jadigenahalli
969
945
961
Haralur
1048
983
917
Vadigehalli
1405
1449
1512
Karibeeranahosahalli
1024
1094
990
Govindapura
1034
1061
1069
Total
1011
1005
984
Source Census of India
Table 6 Work participation
Village name
Work participation (%)
1991
2001
2011
Jadigenahalli
38.72
41.13
41.75
Haralur
38.52
49.57
33.89
Vadigehalli
42.57
36.67
31.07
Karibeeranahosahalli
42.48
40.41
46.66
Govindapura
38.04
53.46
35.77
Total
39.15
44.83
39.60
Source Census of India
4
The Demography of Adaptation to Climate Change, United Nations Population Fund,
International Institute for Environment and Development & El Colegio de México, 2013.
488
S. Manasi et al.