

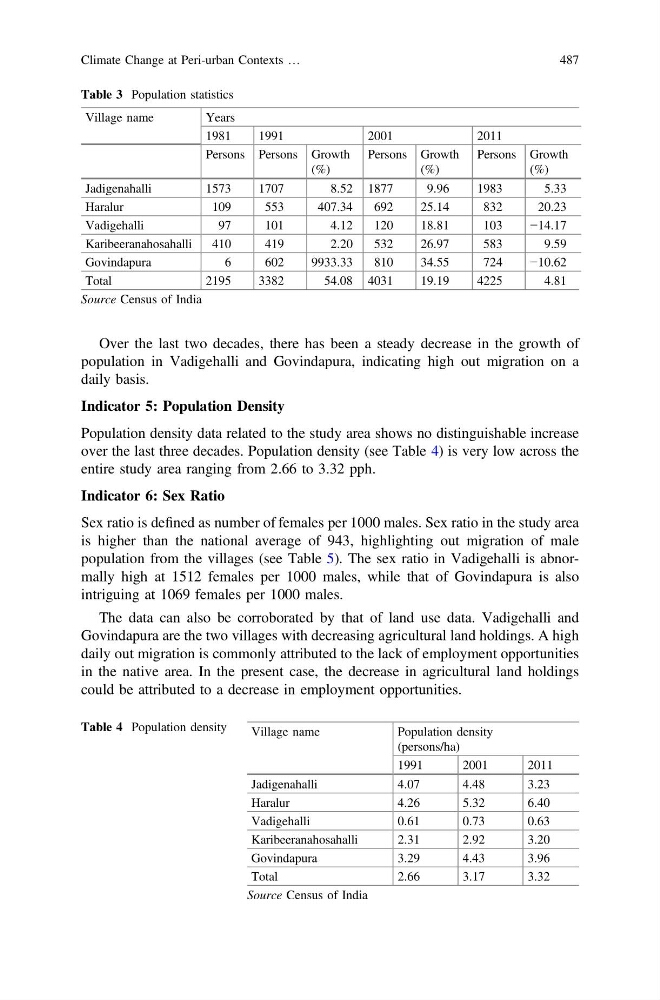
Over the last two decades, there has been a steady decrease in the growth of
population in Vadigehalli and Govindapura, indicating high out migration on a
daily basis.
Indicator 5: Population Density
Population density data related to the study area shows no distinguishable increase
over the last three decades. Population density (see Table 4) is very low across the
entire study area ranging from 2.66 to 3.32 pph.
Indicator 6: Sex Ratio
Sex ratio is defined as number of females per 1000 males. Sex ratio in the study area
is higher than the national average of 943, highlighting out migration of male
population from the villages (see Table 5). The sex ratio in Vadigehalli is abnormally high at 1512 females per 1000 males, while that of Govindapura is also
intriguing at 1069 females per 1000 males.
The data can also be corroborated by that of land use data. Vadigehalli and
Govindapura are the two villages with decreasing agricultural land holdings. A high
daily out migration is commonly attributed to the lack of employment opportunities
in the native area. In the present case, the decrease in agricultural land holdings
could be attributed to a decrease in employment opportunities.
Table 3 Population statistics
Village name
Years
1981
1991
2001
2011
Persons Persons Growth
(%)
Persons Growth
(%)
Persons Growth
(%)
Jadigenahalli
1573
1707
8.52 1877
9.96
1983
5.33
Haralur
109
553
407.34
692
25.14
832
20.23
Vadigehalli
97
101
4.12
120
18.81
103
−14.17
Karibeeranahosahalli
410
419
2.20
532
26.97
583
9.59
Govindapura
6
602
9933.33
810
34.55
724
−10.62
Total
2195
3382
54.08 4031
19.19
4225
4.81
Source Census of India
Table 4 Population density
Village name
Population density
(persons/ha)
1991
2001
2011
Jadigenahalli
4.07
4.48
3.23
Haralur
4.26
5.32
6.40
Vadigehalli
0.61
0.73
0.63
Karibeeranahosahalli
2.31
2.92
3.20
Govindapura
3.29
4.43
3.96
Total
2.66
3.17
3.32
Source Census of India
Climate Change at Peri-urban Contexts …
487
population in Vadigehalli and Govindapura, indicating high out migration on a
daily basis.
Indicator 5: Population Density
Population density data related to the study area shows no distinguishable increase
over the last three decades. Population density (see Table 4) is very low across the
entire study area ranging from 2.66 to 3.32 pph.
Indicator 6: Sex Ratio
Sex ratio is defined as number of females per 1000 males. Sex ratio in the study area
is higher than the national average of 943, highlighting out migration of male
population from the villages (see Table 5). The sex ratio in Vadigehalli is abnormally high at 1512 females per 1000 males, while that of Govindapura is also
intriguing at 1069 females per 1000 males.
The data can also be corroborated by that of land use data. Vadigehalli and
Govindapura are the two villages with decreasing agricultural land holdings. A high
daily out migration is commonly attributed to the lack of employment opportunities
in the native area. In the present case, the decrease in agricultural land holdings
could be attributed to a decrease in employment opportunities.
Table 3 Population statistics
Village name
Years
1981
1991
2001
2011
Persons Persons Growth
(%)
Persons Growth
(%)
Persons Growth
(%)
Jadigenahalli
1573
1707
8.52 1877
9.96
1983
5.33
Haralur
109
553
407.34
692
25.14
832
20.23
Vadigehalli
97
101
4.12
120
18.81
103
−14.17
Karibeeranahosahalli
410
419
2.20
532
26.97
583
9.59
Govindapura
6
602
9933.33
810
34.55
724
−10.62
Total
2195
3382
54.08 4031
19.19
4225
4.81
Source Census of India
Table 4 Population density
Village name
Population density
(persons/ha)
1991
2001
2011
Jadigenahalli
4.07
4.48
3.23
Haralur
4.26
5.32
6.40
Vadigehalli
0.61
0.73
0.63
Karibeeranahosahalli
2.31
2.92
3.20
Govindapura
3.29
4.43
3.96
Total
2.66
3.17
3.32
Source Census of India
Climate Change at Peri-urban Contexts …
487