

Inferences from Climate-Related Indicators
In Asia and the pacific region, there is evidence of a prominent increase in the
intensity of extreme events such as heat waves, tropical cyclones, prolonged dry
spells, intense rainfall, tornadoes, avalanches, thunderstorms, and sever dust storms.
The region is highly subjected to natural hazards like 2004 Indian Ocean Tsunami,
2005 Pakistan Earthquake, and 2006 landslides in Philippines (IPCC, 4th Report),
but in the case of the semi-arid region, the villages belonging to Jadigenahalli Gram
panchayat are not found affected to such an extreme extent by climate vulnerability,
as the region is located 900 m above (average) from the sea level. With respect to
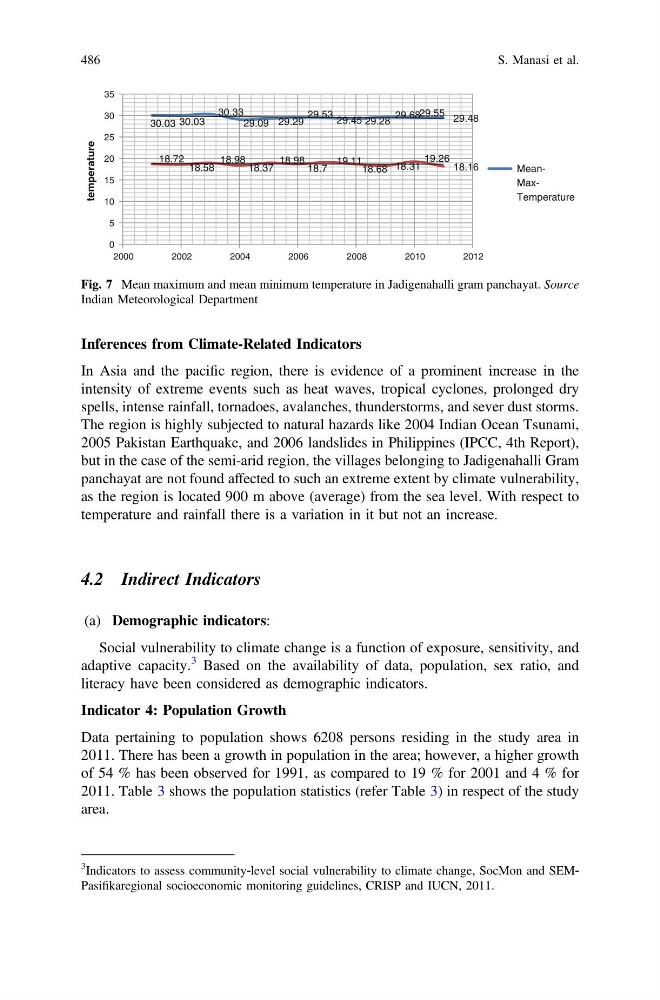
temperature and rainfall there is a variation in it but not an increase.
4.2 Indirect Indicators
(a) Demographic indicators:
Social vulnerability to climate change is a function of exposure, sensitivity, and
adaptive capacity.
3 Based on the availability of data, population, sex ratio, and
literacy have been considered as demographic indicators.
Indicator 4: Population Growth
Data pertaining to population shows 6208 persons residing in the study area in
2011. There has been a growth in population in the area; however, a higher growth
of 54 % has been observed for 1991, as compared to 19 % for 2001 and 4 % for
2011. Table 3 shows the population statistics (refer Table 3) in respect of the study
area.
30.03 30.03
30.33
29.09 29.29
29.53 29.45 29.28
29.68 29.55 29.48
18.72
18.58
18.98
18.37
18.98
18.7
19.11
18.68 18.31
19.26
18.16
0
5
10
15
20
25
30
35
2000
2002
2004
2006
2008
2010
2012
temperature
MaxTemperature
Fig. 7 Mean maximum and mean minimum temperature in Jadigenahalli gram panchayat. Source
Indian Meteorological Department
3
Indicators to assess community‐level social vulnerability to climate change, SocMon and SEM‐
Pasifikaregional socioeconomic monitoring guidelines, CRISP and IUCN, 2011.
486
S. Manasi et al.
In Asia and the pacific region, there is evidence of a prominent increase in the
intensity of extreme events such as heat waves, tropical cyclones, prolonged dry
spells, intense rainfall, tornadoes, avalanches, thunderstorms, and sever dust storms.
The region is highly subjected to natural hazards like 2004 Indian Ocean Tsunami,
2005 Pakistan Earthquake, and 2006 landslides in Philippines (IPCC, 4th Report),
but in the case of the semi-arid region, the villages belonging to Jadigenahalli Gram
panchayat are not found affected to such an extreme extent by climate vulnerability,
as the region is located 900 m above (average) from the sea level. With respect to
temperature and rainfall there is a variation in it but not an increase.
4.2 Indirect Indicators
(a) Demographic indicators:
Social vulnerability to climate change is a function of exposure, sensitivity, and
adaptive capacity.
3 Based on the availability of data, population, sex ratio, and
literacy have been considered as demographic indicators.
Indicator 4: Population Growth
Data pertaining to population shows 6208 persons residing in the study area in
2011. There has been a growth in population in the area; however, a higher growth
of 54 % has been observed for 1991, as compared to 19 % for 2001 and 4 % for
2011. Table 3 shows the population statistics (refer Table 3) in respect of the study
area.
30.03 30.03
30.33
29.09 29.29
29.53 29.45 29.28
29.68 29.55 29.48
18.72
18.58
18.98
18.37
18.98
18.7
19.11
18.68 18.31
19.26
18.16
0
5
10
15
20
25
30
35
2000
2002
2004
2006
2008
2010
2012
temperature
MaxTemperature
Fig. 7 Mean maximum and mean minimum temperature in Jadigenahalli gram panchayat. Source
Indian Meteorological Department
3
Indicators to assess community‐level social vulnerability to climate change, SocMon and SEM‐
Pasifikaregional socioeconomic monitoring guidelines, CRISP and IUCN, 2011.
486
S. Manasi et al.