

boundary, taluk boundary, existing roads, and natural features were digitized.
Cartography has been used for all these features as per the KTCP act 1961 for
producing a base map.
Formation of a spatially linked indicator database: Quantitative indicators
were identified pertaining to the categories of ‘land use–land cover,’ ‘demography,’
‘economy,’ and ‘climatology.’ Data pertaining to the indicators were collected from
the relevant sources (census, IMD, KSRSAC) and an indicator database formulated
as per the formulae/methodology indicated in Table 1. The database was then
linked to the villages in the geo-database forming a spatially linked indicator
database.
The following table presents a list of 15 quantitative indicators, the data required
for forming the indicators and the sources of the same.
The indicators were measured across three points of time 1991, 2001, and 2014
to assess the increase or decrease in the indicator values. Based on the range of
values for the first year of assessment, the data was classified as ‘low,’ ‘medium,’
and ‘high.’ A similar classification for all the years helps us trace an increase or
decrease in the indicator values.
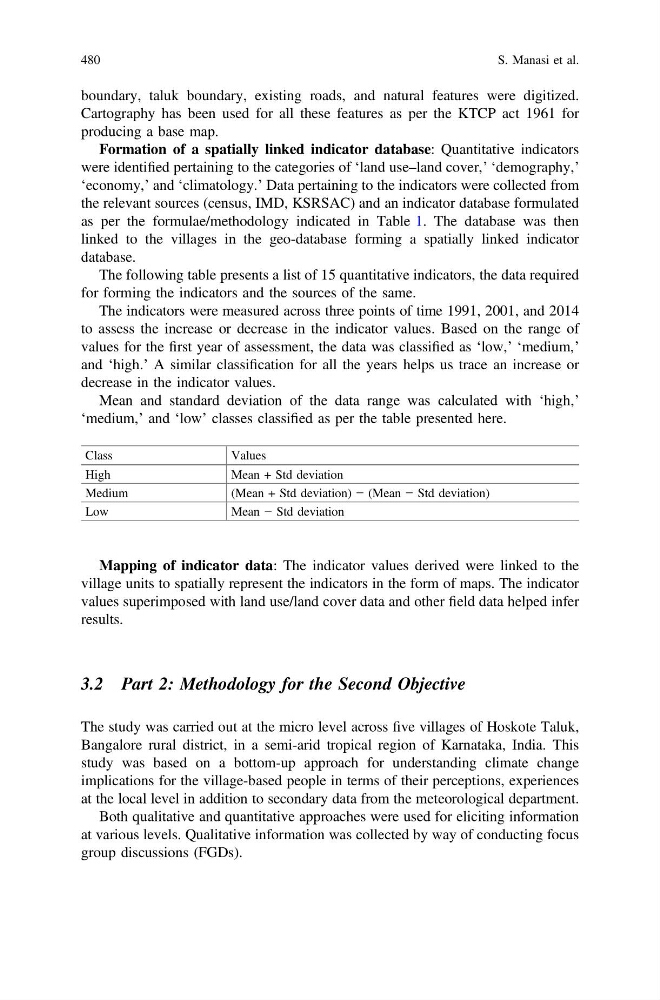
Mean and standard deviation of the data range was calculated with ‘high,’
‘medium,’ and ‘low’ classes classified as per the table presented here.
Class
Values
High
Mean + Std deviation
Medium
(Mean + Std deviation) − (Mean − Std deviation)
Low
Mean − Std deviation
Mapping of indicator data: The indicator values derived were linked to the
village units to spatially represent the indicators in the form of maps. The indicator
values superimposed with land use/land cover data and other field data helped infer
results.
3.2 Part 2: Methodology for the Second Objective
The study was carried out at the micro level across five villages of Hoskote Taluk,
Bangalore rural district, in a semi-arid tropical region of Karnataka, India. This
study was based on a bottom-up approach for understanding climate change
implications for the village-based people in terms of their perceptions, experiences
at the local level in addition to secondary data from the meteorological department.
Both qualitative and quantitative approaches were used for eliciting information
at various levels. Qualitative information was collected by way of conducting focus
group discussions (FGDs).
480
S. Manasi et al.
Cartography has been used for all these features as per the KTCP act 1961 for
producing a base map.
Formation of a spatially linked indicator database: Quantitative indicators
were identified pertaining to the categories of ‘land use–land cover,’ ‘demography,’
‘economy,’ and ‘climatology.’ Data pertaining to the indicators were collected from
the relevant sources (census, IMD, KSRSAC) and an indicator database formulated
as per the formulae/methodology indicated in Table 1. The database was then
linked to the villages in the geo-database forming a spatially linked indicator
database.
The following table presents a list of 15 quantitative indicators, the data required
for forming the indicators and the sources of the same.
The indicators were measured across three points of time 1991, 2001, and 2014
to assess the increase or decrease in the indicator values. Based on the range of
values for the first year of assessment, the data was classified as ‘low,’ ‘medium,’
and ‘high.’ A similar classification for all the years helps us trace an increase or
decrease in the indicator values.
Mean and standard deviation of the data range was calculated with ‘high,’
‘medium,’ and ‘low’ classes classified as per the table presented here.
Class
Values
High
Mean + Std deviation
Medium
(Mean + Std deviation) − (Mean − Std deviation)
Low
Mean − Std deviation
Mapping of indicator data: The indicator values derived were linked to the
village units to spatially represent the indicators in the form of maps. The indicator
values superimposed with land use/land cover data and other field data helped infer
results.
3.2 Part 2: Methodology for the Second Objective
The study was carried out at the micro level across five villages of Hoskote Taluk,
Bangalore rural district, in a semi-arid tropical region of Karnataka, India. This
study was based on a bottom-up approach for understanding climate change
implications for the village-based people in terms of their perceptions, experiences
at the local level in addition to secondary data from the meteorological department.
Both qualitative and quantitative approaches were used for eliciting information
at various levels. Qualitative information was collected by way of conducting focus
group discussions (FGDs).
480
S. Manasi et al.