

6 Impact of Climate Change on Agricultural Output
We note that agriculture in India continues to be highly sensitive to monsoon
variability with 65 % of the cropped area being rainfed (Revi 2008). Since climate
change is expected to increase the vulnerability of Indian agriculture, I estimate
primary (agricultural) DDP as dependent on climate change characteristics such as
temperature differences and rainfall, along with others, for all districts and separately by controlling for coastal locations.
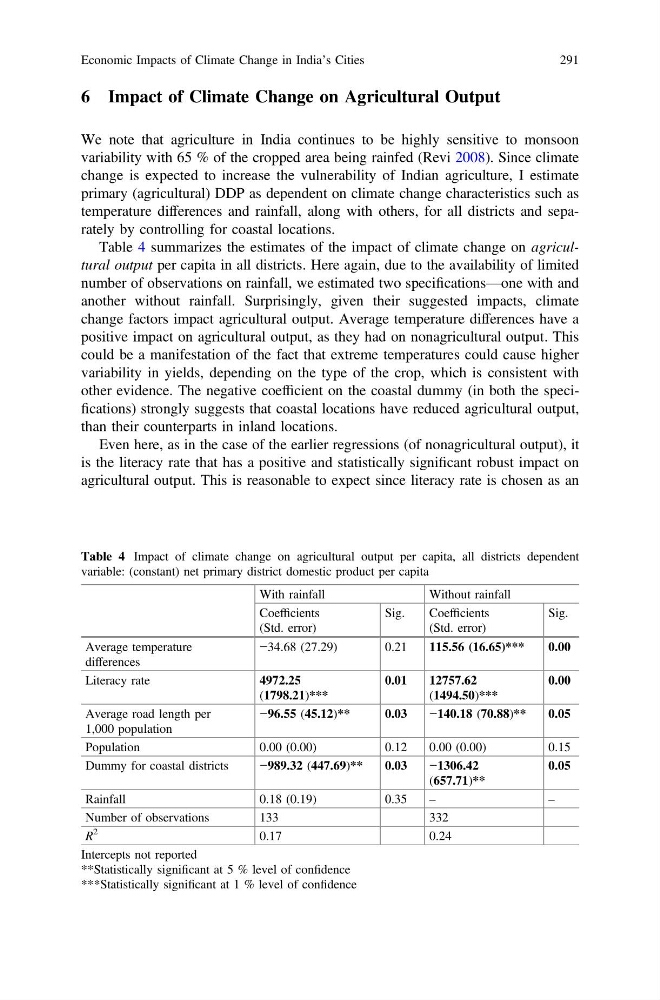
Table 4 summarizes the estimates of the impact of climate change on agricultural output per capita in all districts. Here again, due to the availability of limited
number of observations on rainfall, we estimated two specifications—one with and
another without rainfall. Surprisingly, given their suggested impacts, climate
change factors impact agricultural output. Average temperature differences have a
positive impact on agricultural output, as they had on nonagricultural output. This
could be a manifestation of the fact that extreme temperatures could cause higher
variability in yields, depending on the type of the crop, which is consistent with
other evidence. The negative coefficient on the coastal dummy (in both the specifications) strongly suggests that coastal locations have reduced agricultural output,
than their counterparts in inland locations.
Even here, as in the case of the earlier regressions (of nonagricultural output), it
is the literacy rate that has a positive and statistically significant robust impact on
agricultural output. This is reasonable to expect since literacy rate is chosen as an
Table 4 Impact of climate change on agricultural output per capita, all districts dependent
variable: (constant) net primary district domestic product per capita
With rainfall
Without rainfall
Coefficients
(Std. error)
Sig.
Coefficients
(Std. error)
Sig.
Average temperature
differences
−34.68 (27.29)
0.21
115.56 (16.65)***
0.00
Literacy rate
4972.25
(1798.21)***
0.01
12757.62
(1494.50)***
0.00
Average road length per
1,000 population
−96.55 (45.12)**
0.03
−140.18 (70.88)**
0.05
Population
0.00 (0.00)
0.12
0.00 (0.00)
0.15
Dummy for coastal districts
−989.32 (447.69)**
0.03
−1306.42
(657.71)**
0.05
Rainfall
0.18 (0.19)
0.35
–
–
Number of observations
133
332
R
2
0.17
0.24
Intercepts not reported
**Statistically significant at 5 % level of confidence
***Statistically significant at 1 % level of confidence
Economic Impacts of Climate Change in India’s Cities
291
We note that agriculture in India continues to be highly sensitive to monsoon
variability with 65 % of the cropped area being rainfed (Revi 2008). Since climate
change is expected to increase the vulnerability of Indian agriculture, I estimate
primary (agricultural) DDP as dependent on climate change characteristics such as
temperature differences and rainfall, along with others, for all districts and separately by controlling for coastal locations.
Table 4 summarizes the estimates of the impact of climate change on agricultural output per capita in all districts. Here again, due to the availability of limited
number of observations on rainfall, we estimated two specifications—one with and
another without rainfall. Surprisingly, given their suggested impacts, climate
change factors impact agricultural output. Average temperature differences have a
positive impact on agricultural output, as they had on nonagricultural output. This
could be a manifestation of the fact that extreme temperatures could cause higher
variability in yields, depending on the type of the crop, which is consistent with
other evidence. The negative coefficient on the coastal dummy (in both the specifications) strongly suggests that coastal locations have reduced agricultural output,
than their counterparts in inland locations.
Even here, as in the case of the earlier regressions (of nonagricultural output), it
is the literacy rate that has a positive and statistically significant robust impact on
agricultural output. This is reasonable to expect since literacy rate is chosen as an
Table 4 Impact of climate change on agricultural output per capita, all districts dependent
variable: (constant) net primary district domestic product per capita
With rainfall
Without rainfall
Coefficients
(Std. error)
Sig.
Coefficients
(Std. error)
Sig.
Average temperature
differences
−34.68 (27.29)
0.21
115.56 (16.65)***
0.00
Literacy rate
4972.25
(1798.21)***
0.01
12757.62
(1494.50)***
0.00
Average road length per
1,000 population
−96.55 (45.12)**
0.03
−140.18 (70.88)**
0.05
Population
0.00 (0.00)
0.12
0.00 (0.00)
0.15
Dummy for coastal districts
−989.32 (447.69)**
0.03
−1306.42
(657.71)**
0.05
Rainfall
0.18 (0.19)
0.35
–
–
Number of observations
133
332
R
2
0.17
0.24
Intercepts not reported
**Statistically significant at 5 % level of confidence
***Statistically significant at 1 % level of confidence
Economic Impacts of Climate Change in India’s Cities
291